
- 📖 Geeky Medics OSCE Book
- ⚡ Geeky Medics Bundles
- ✨ 1300+ OSCE Stations
- ✅ OSCE Checklist PDF Booklet
- 🧠 UKMLA AKT Question Bank
- 💊 PSA Question Bank
- 💉 Clinical Skills App
- 🗂️ Flashcard Collections | OSCE, Medicine, Surgery, Anatomy
- 💬 SCA Cases for MRCGP
To be the first to know about our latest videos subscribe to our YouTube channel 🙌
What is an ECG?
ECG is the abbreviated term for an electrocardiogram. It is used to record the electrical activity of the heart from different angles to both identify and locate pathology. Electrodes are placed on different parts of a patient’s limbs and chest to record the electrical activity.
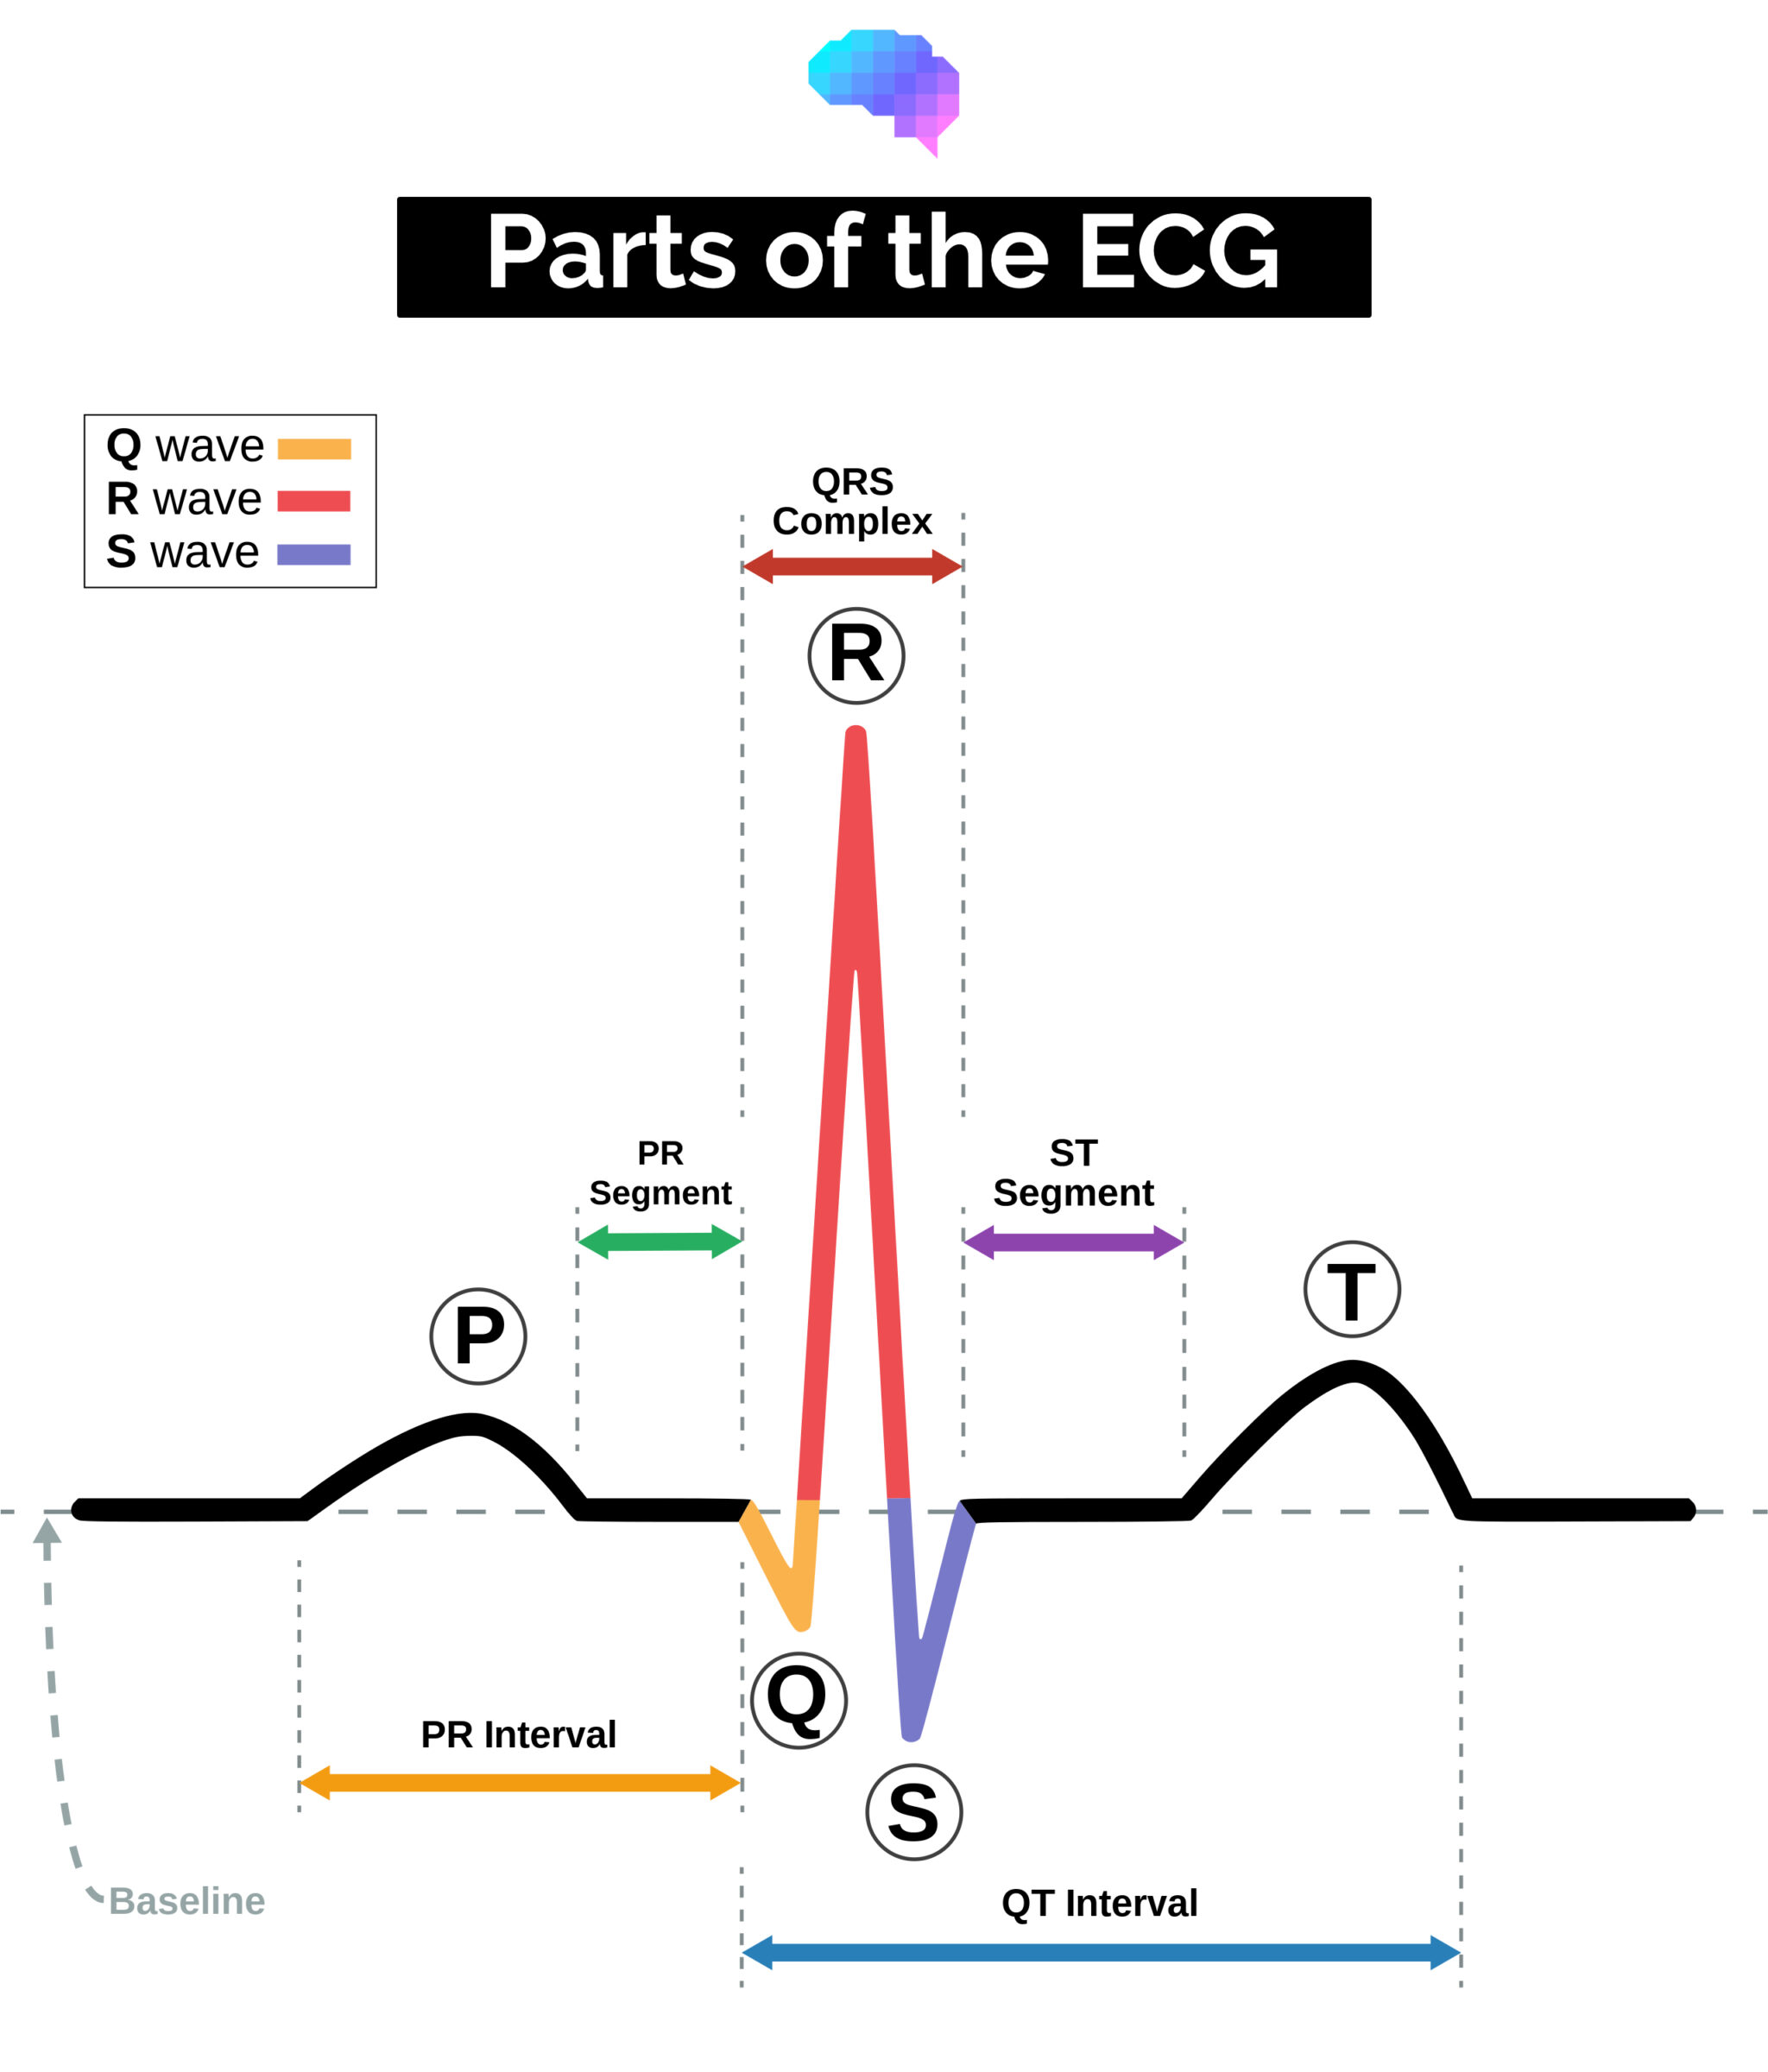
Parts of the ECG explained
P waves
P waves represent atrial depolarisation.
In healthy individuals, there should be a P wave preceding each QRS complex.
PR interval
The PR interval begins at the start of the P wave and ends at the beginning of the Q wave.
It represents the time for electrical activity to move between the atria and the ventricles.
QRS complex
The QRS complex represents the depolarisation of the ventricles.
It appears as three closely related waves on the ECG (the Q, R and S wave).
ST segment
The ST segment starts at the end of the S wave and ends at the beginning of the T wave.
The ST segment is an isoelectric line representing the time between depolarisation and repolarisation of the ventricles (i.e. ventricular contraction).
T wave
The T wave represents ventricular repolarisation.
It appears as a small wave after the QRS complex.
RR interval
The RR interval begins at the peak of one R wave and ends at the peak of the next R wave.
It represents the time between two QRS complexes.
QT interval
The QT interval begins at the start of the QRS complex and finishes at the end of the T wave.
It represents the time taken for the ventricles to depolarise and then repolarise.
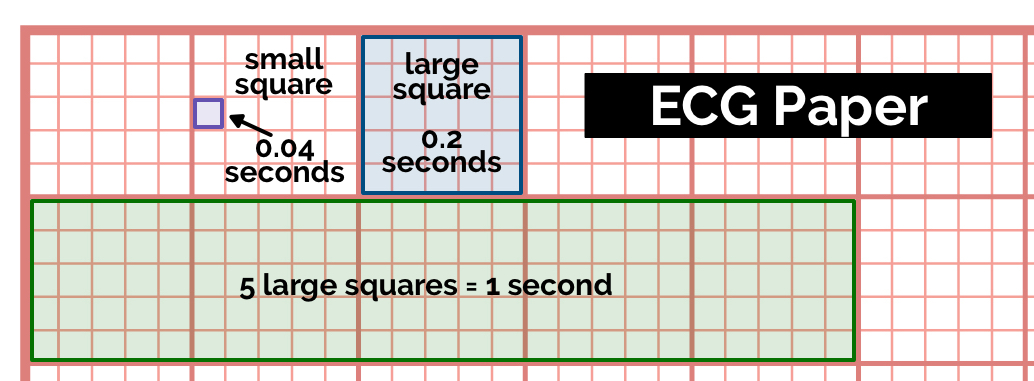
How to read ECG paper
The paper used to record ECGs is standardised across most hospitals and has the following characteristics:
- Each small square represents 0.04 seconds
- Each large square represents 0.2 seconds
- 5 large squares = 1 second
- 300 large squares = 1 minute
How the 12-lead ECG works
Understanding the difference between an ECG electrode and an ECG lead is important:
- An ECG electrode is a conductive pad attached to the skin to record electrical activity.
- An ECG lead is a graphical representation of the heart’s electrical activity which is calculated by analysing data from several ECG electrodes.
A 12-lead ECG records 12 leads, producing 12 separate graphs on a piece of ECG paper.
Only 10 physical electrodes are attached to the patient to generate the 12 leads.
Electrodes
An ECG electrode is a conductive pad attached to the skin to record electrical activity.
The data gathered from these electrodes allows the 12 leads of the ECG to be calculated (e.g. lead I is calculated using data from the electrodes on both the right and left arm).
The electrodes used to generate a 12-lead ECG are described below.
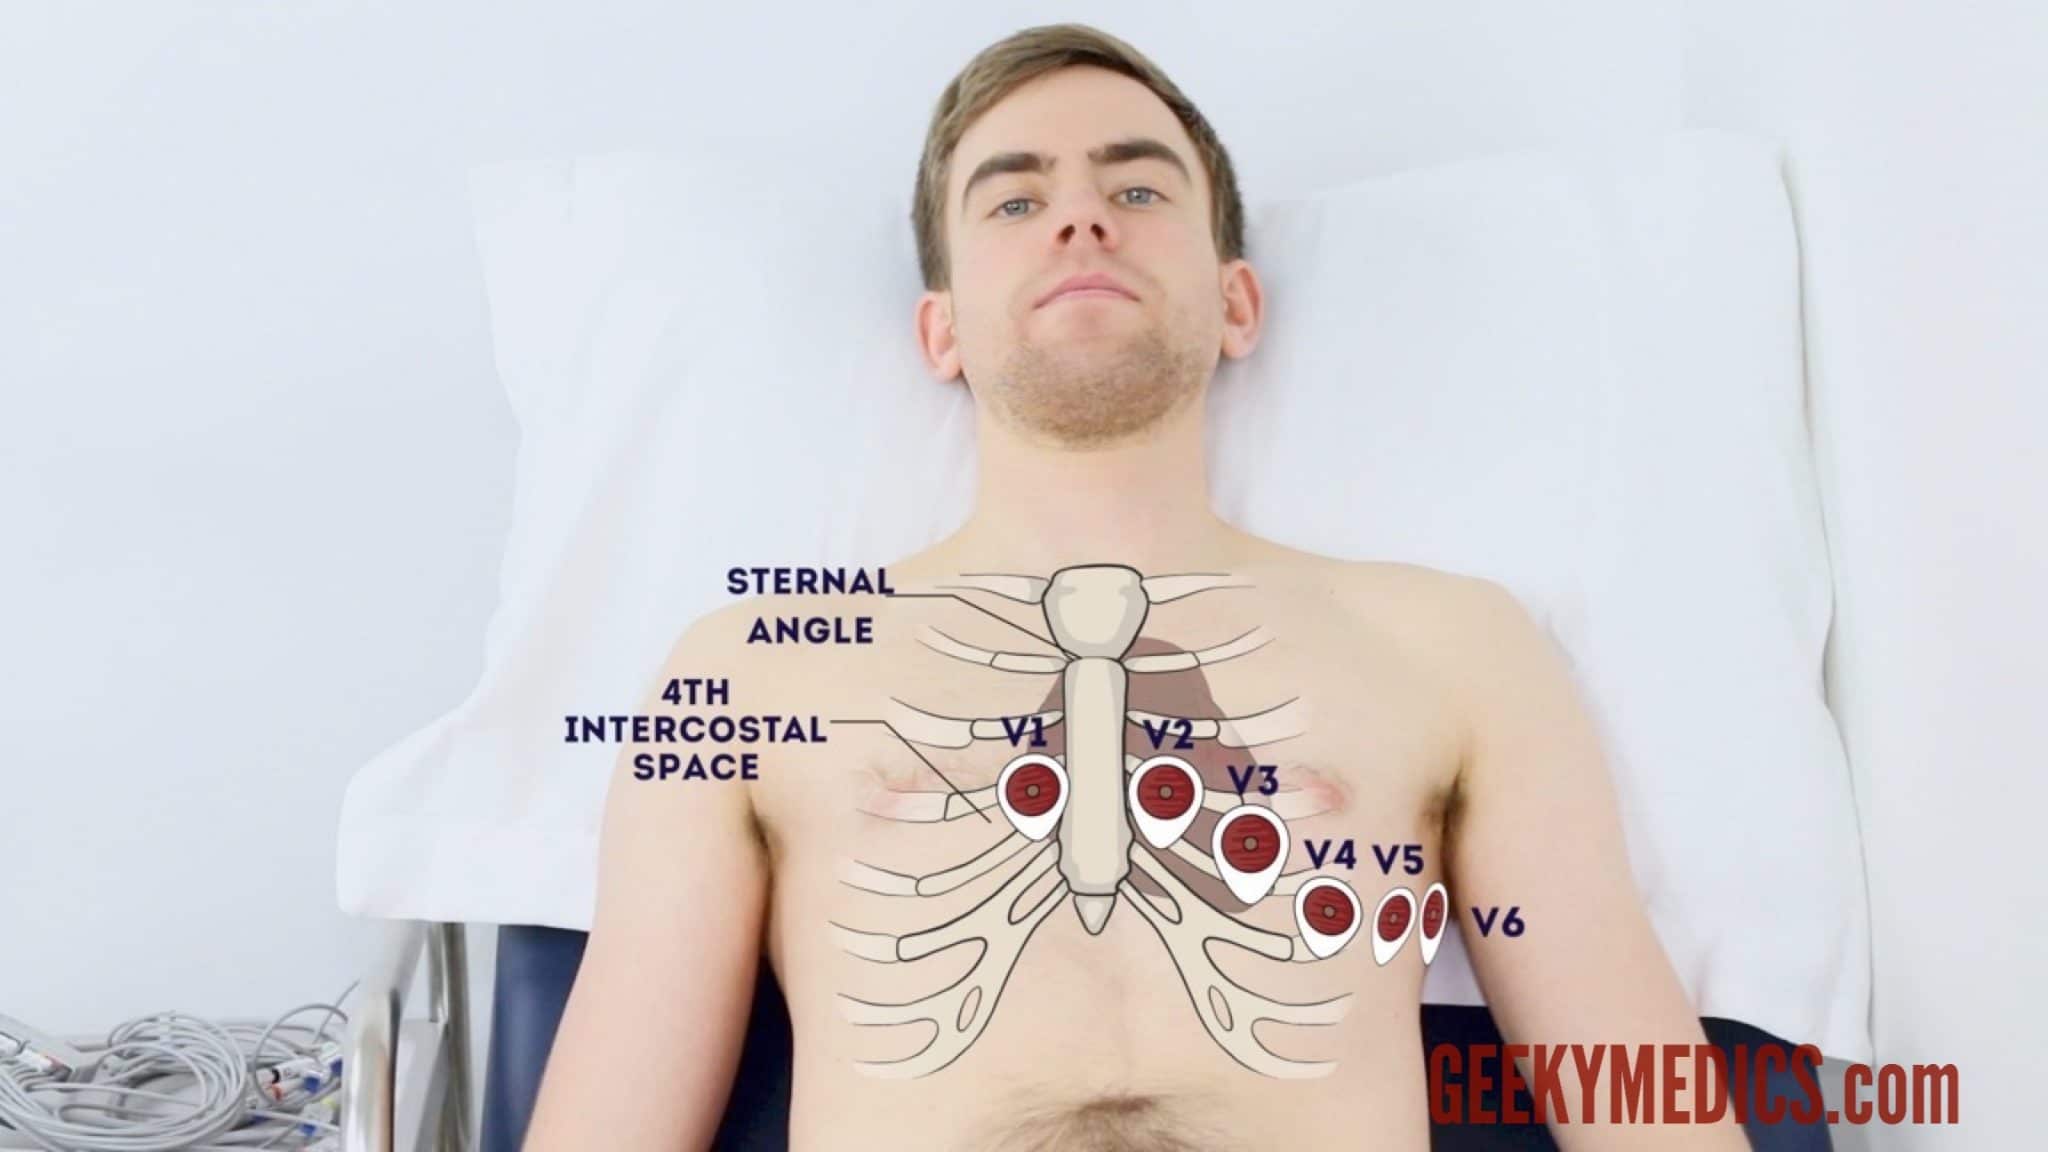
Chest electrodes
Table 1. The chest electrodes and their placement.
| Electrode | Location on the body |
| V1 | 4th intercostal space at the right sternal edge |
| V2 | 4th intercostal space at the left sternal edge |
| V3 | Midway between the V2 and V4 electrodes |
| V4 | 5th intercostal space in the midclavicular line |
| V5 | Left anterior axillary line at the same horizontal level as V4 |
| V6 | Left mid-axillary line at the same horizontal level as V4 and V5 |
Limb electrodes
There are four limb electrodes.
Table 2. The limb electrodes and their placement
| Electrode | Location on the body |
| Red (RA) | Ulnar styloid process of the right arm |
| Yellow (LA) | Ulnar styloid process of the left arm |
| Green (LL) | Medial or lateral malleolus of the left leg |
| Black (RL) | Medial or lateral malleolus of the right leg |
Leads
An ECG lead is a graphical representation of the heart’s electrical activity calculated by analysing data from several ECG electrodes.
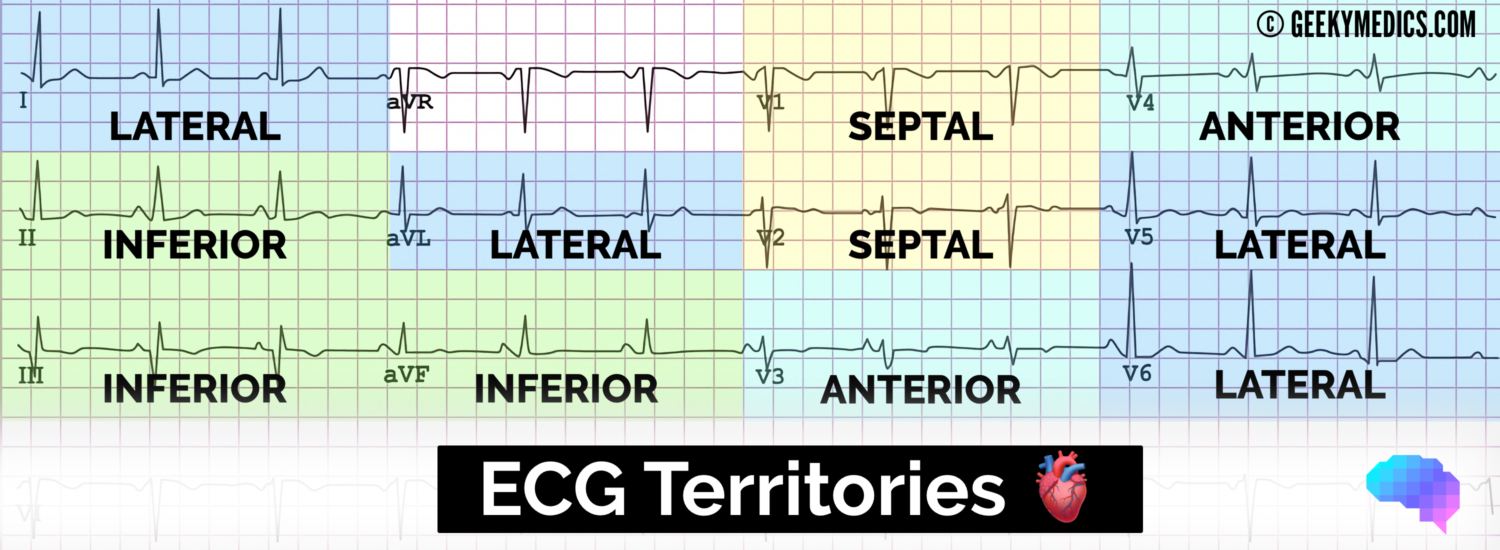
Chest leads
Table 3. The chest leads.
| Electrode | View of the heart |
| V1 | Septal view of the heart |
| V2 | Septal view of the heart |
| V3 | Anterior view of the heart |
| V4 | Anterior view of the heart |
| V5 | Lateral view of the heart |
| V6 | Lateral view of the heart |
Other leads
Table 4. Other leads.
| Electrode | View of the heart |
| Lead I | Lateral view (calculated by analysing activity between the RA and LA electrodes) |
| Lead II | Inferior view (calculated by analysing activity between the RA and LL electrodes) |
| Lead III | Inferior view (calculated by analysing activity between the LA and LL electrodes) |
| aVR | Lateral view (calculated by analysing activity between LA+LL -> RA) |
| AVL | Lateral view (calculated by analysing activity between RA+LL -> LA) |
| aVF | Inferior view (calculated by analysing activity between RA+LA -> LL) |
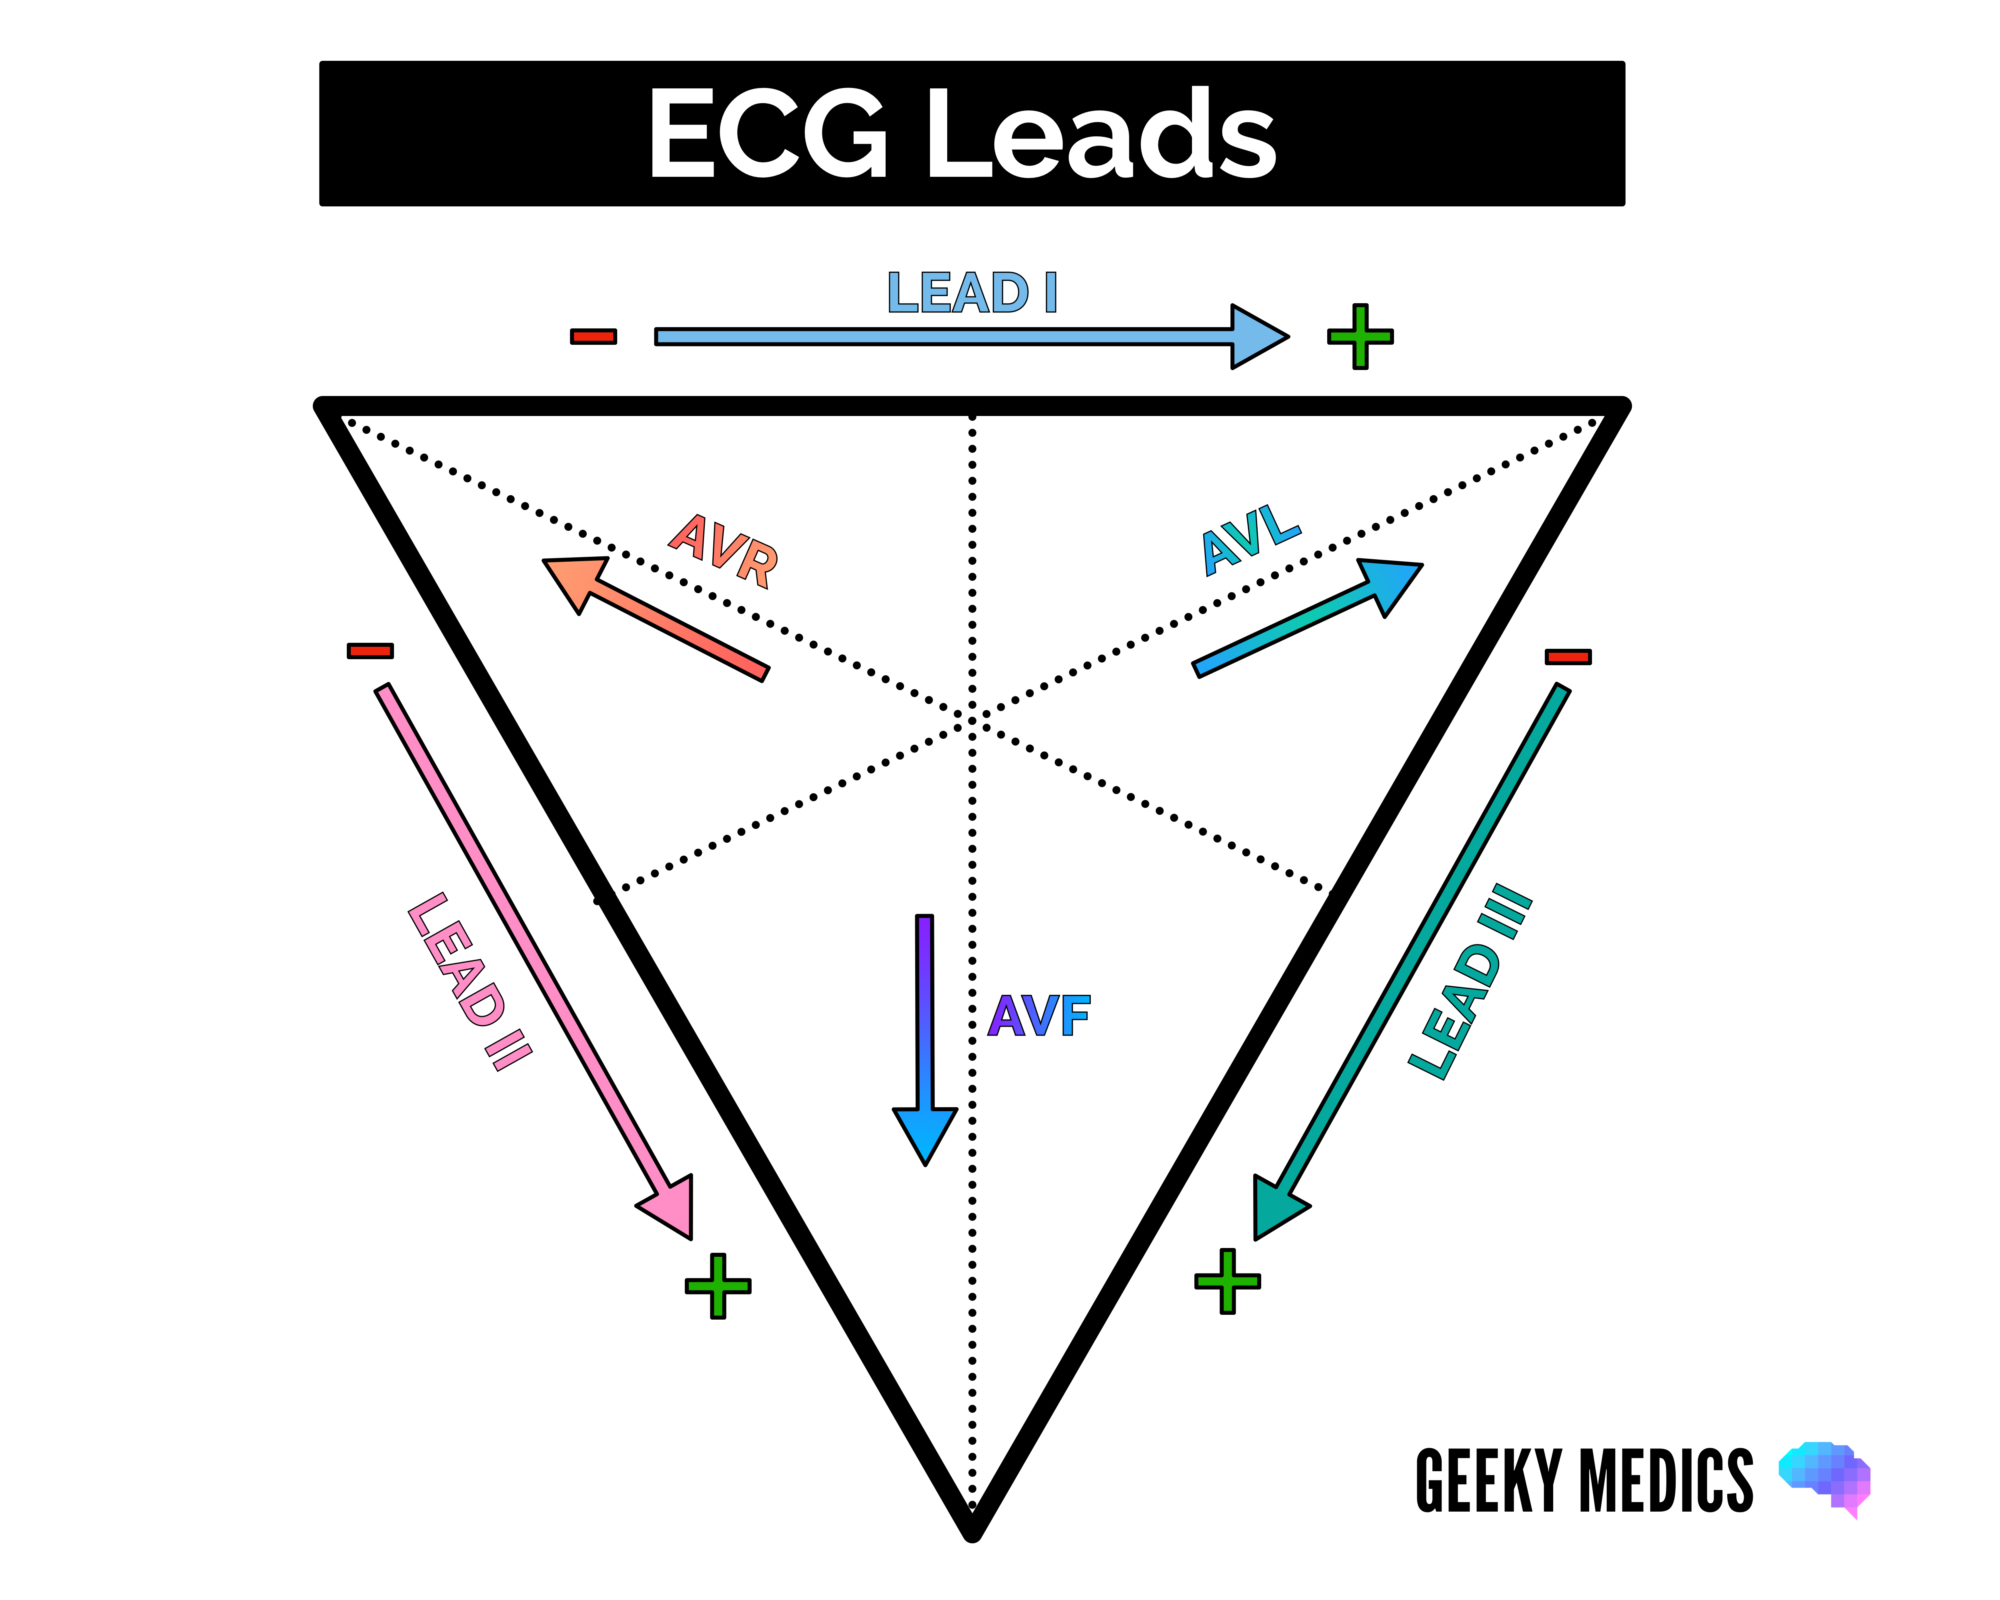
The shape of the ECG waveform
Each lead’s ECG recording is slightly different in shape. This is because each lead is recording the heart’s electrical activity from a different direction (a.k.a viewpoint).
When the electrical activity within the heart travels towards a lead, you get a positive deflection.
When the electrical activity within the heart travels away from a lead, you get a negative deflection.
In reality, electrical activity in the heart flows in many directions simultaneously.
Each deflection (a.k.a. wave) on the ECG represents the average direction of electrical travel (calculated using the ECG machine’s mathematical formulae).
The deflection height represents the amount of electrical activity flowing in that direction (i.e. the higher the deflection, the greater the amount of electrical activity flowing towards the lead).
The lead with the most positive deflection is most aligned with the direction the heart’s electrical activity is travelling.
If the R wave is greater than the S wave, it suggests depolarisation is moving towards that lead.
If the S wave is greater than the R wave,it suggests depolarisation is moving away from that lead.
If the R and S waves are of equal size, it means depolarisation is travelling at exactly 90° to that lead.
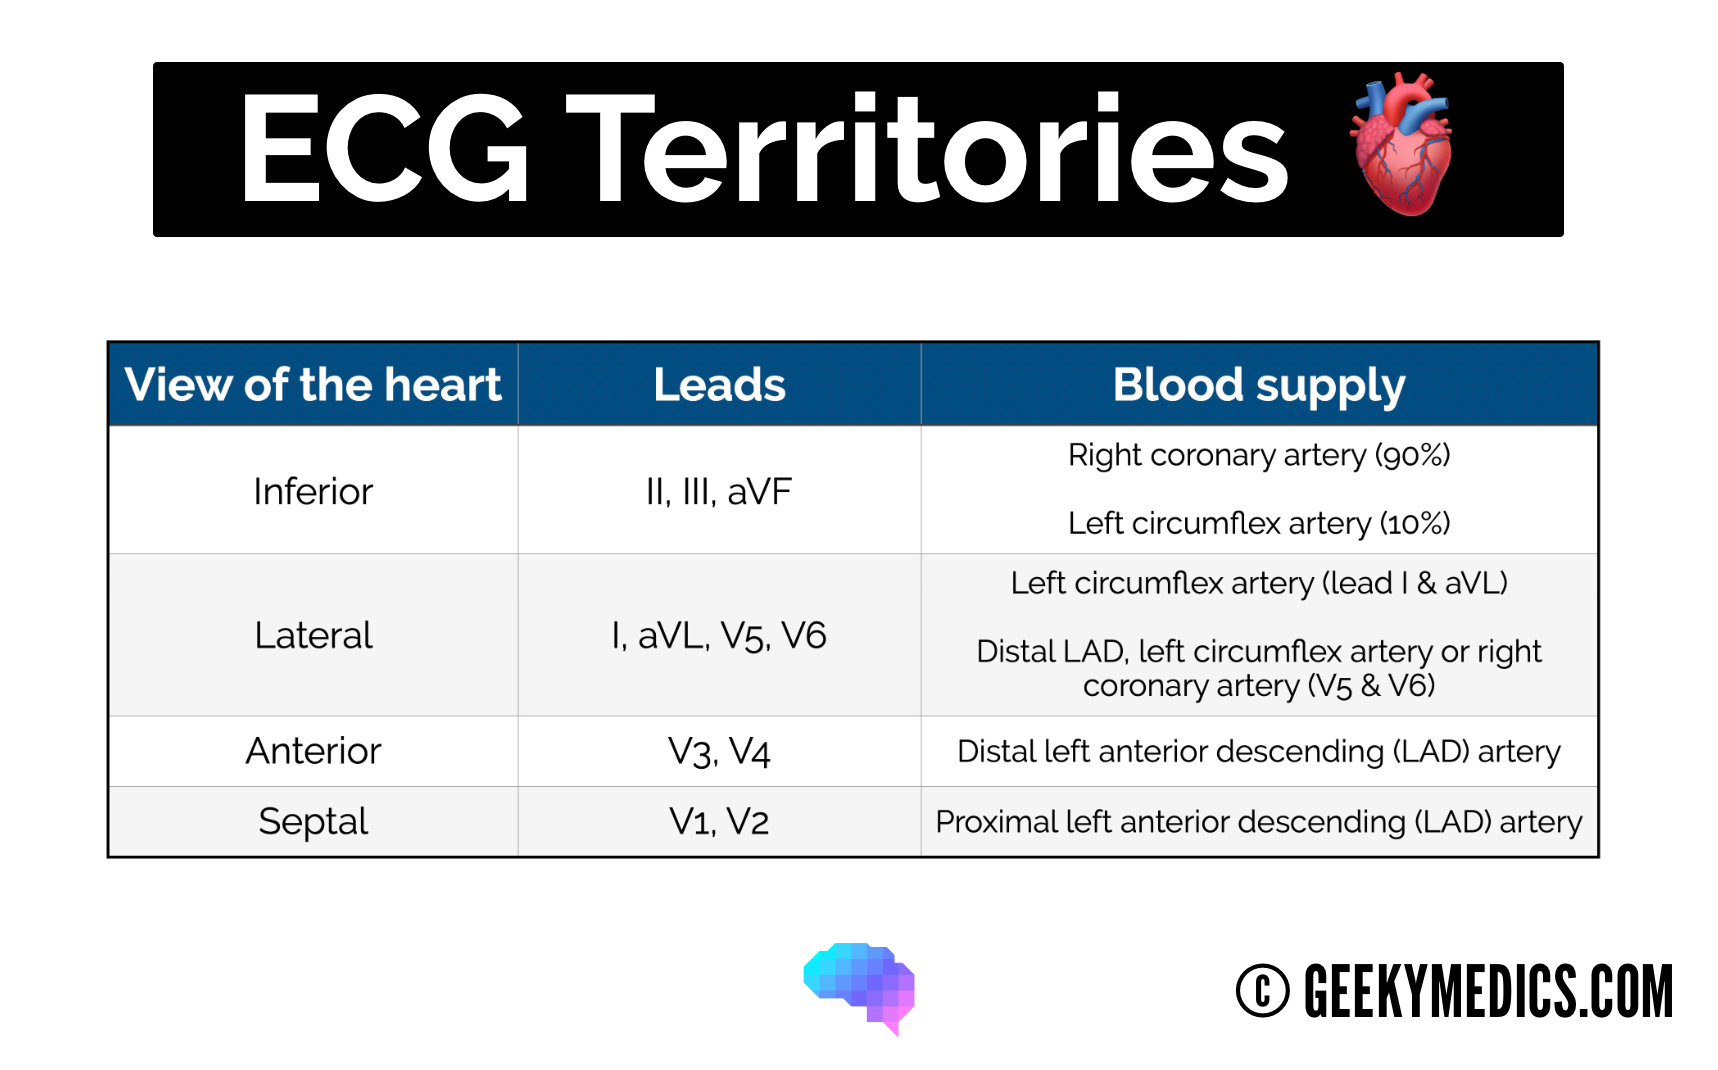
Localising pathology on the ECG
It’s important to understand which leads represent which anatomical territory of the heart, as this allows you to localise pathology to a particular heart region.
For example, if there is ST elevation in leads V3 and V4, it suggests an anterior myocardial infarction (MI). You can then combine this with some anatomical knowledge of the heart’s blood supply to work out which artery is likely to be affected (e.g. left anterior descending artery).
Cardiac axis
In healthy individuals, the electrical activity of the heart begins at the sinoatrial node then spreads to the atrioventricular (AV) node. It then spreads down the bundle of His and Purkinje fibres to cause ventricular contraction.
Whenever the direction of electrical activity moves towards a lead, a positive deflection is produced.
Whenever the direction of electrical activity moves away from a lead, a negative deflection is produced.
The cardiac axis gives us an idea of the overall direction of electrical activity.
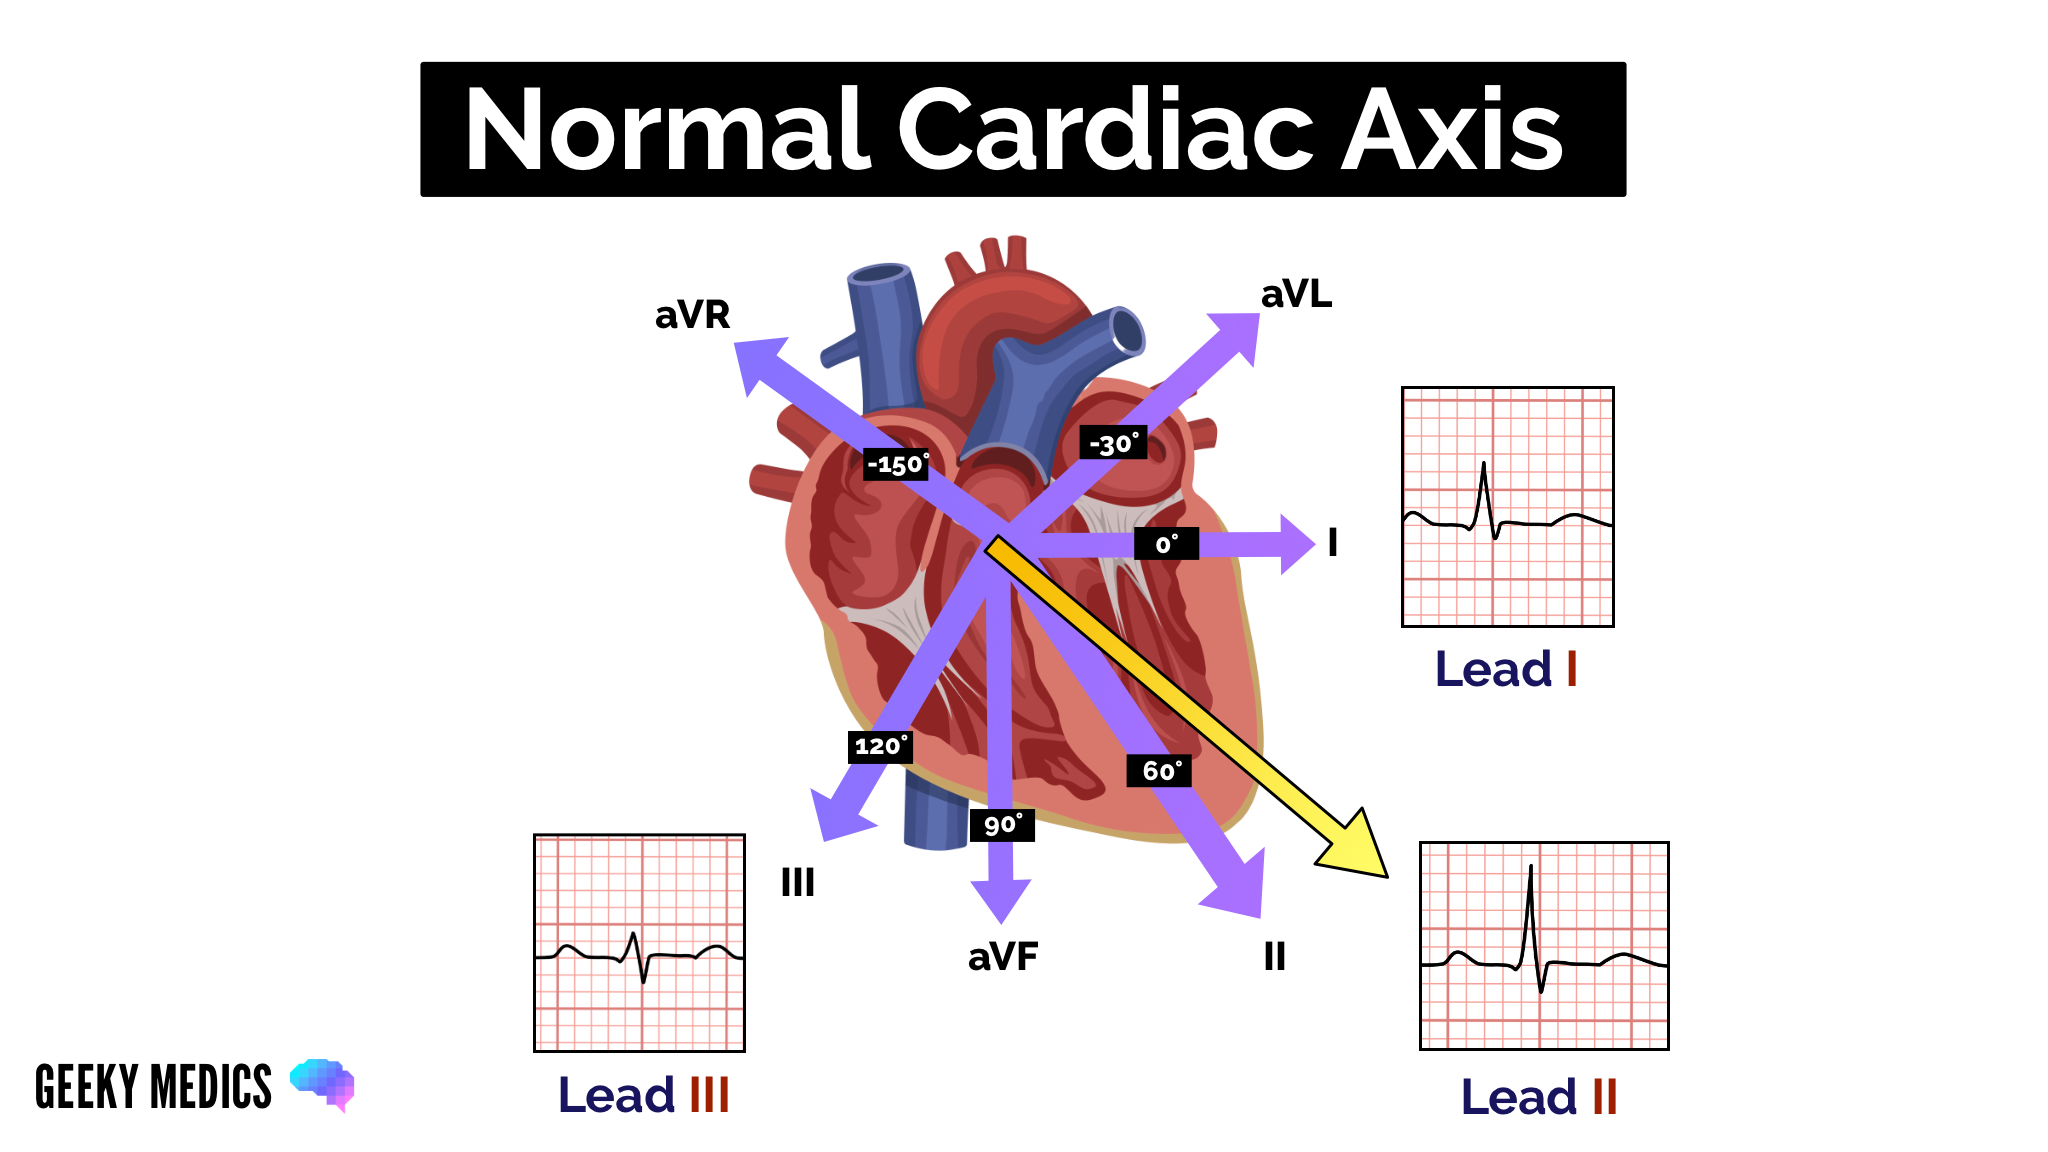
Normal cardiac axis
In healthy individuals, you would expect the cardiac axis to lie between -30°and +90º. The overall direction of electrical activity is therefore towards leads I, II and III (the yellow arrow below). As a result, you see a positive deflection in all these leads, with lead II showing the most positive deflection as it is the most closely aligned to the overall direction of electrical spread. You would expect to see the most negative deflection in aVR. This is due to aVR providing a viewpoint of the heart from the opposite direction.
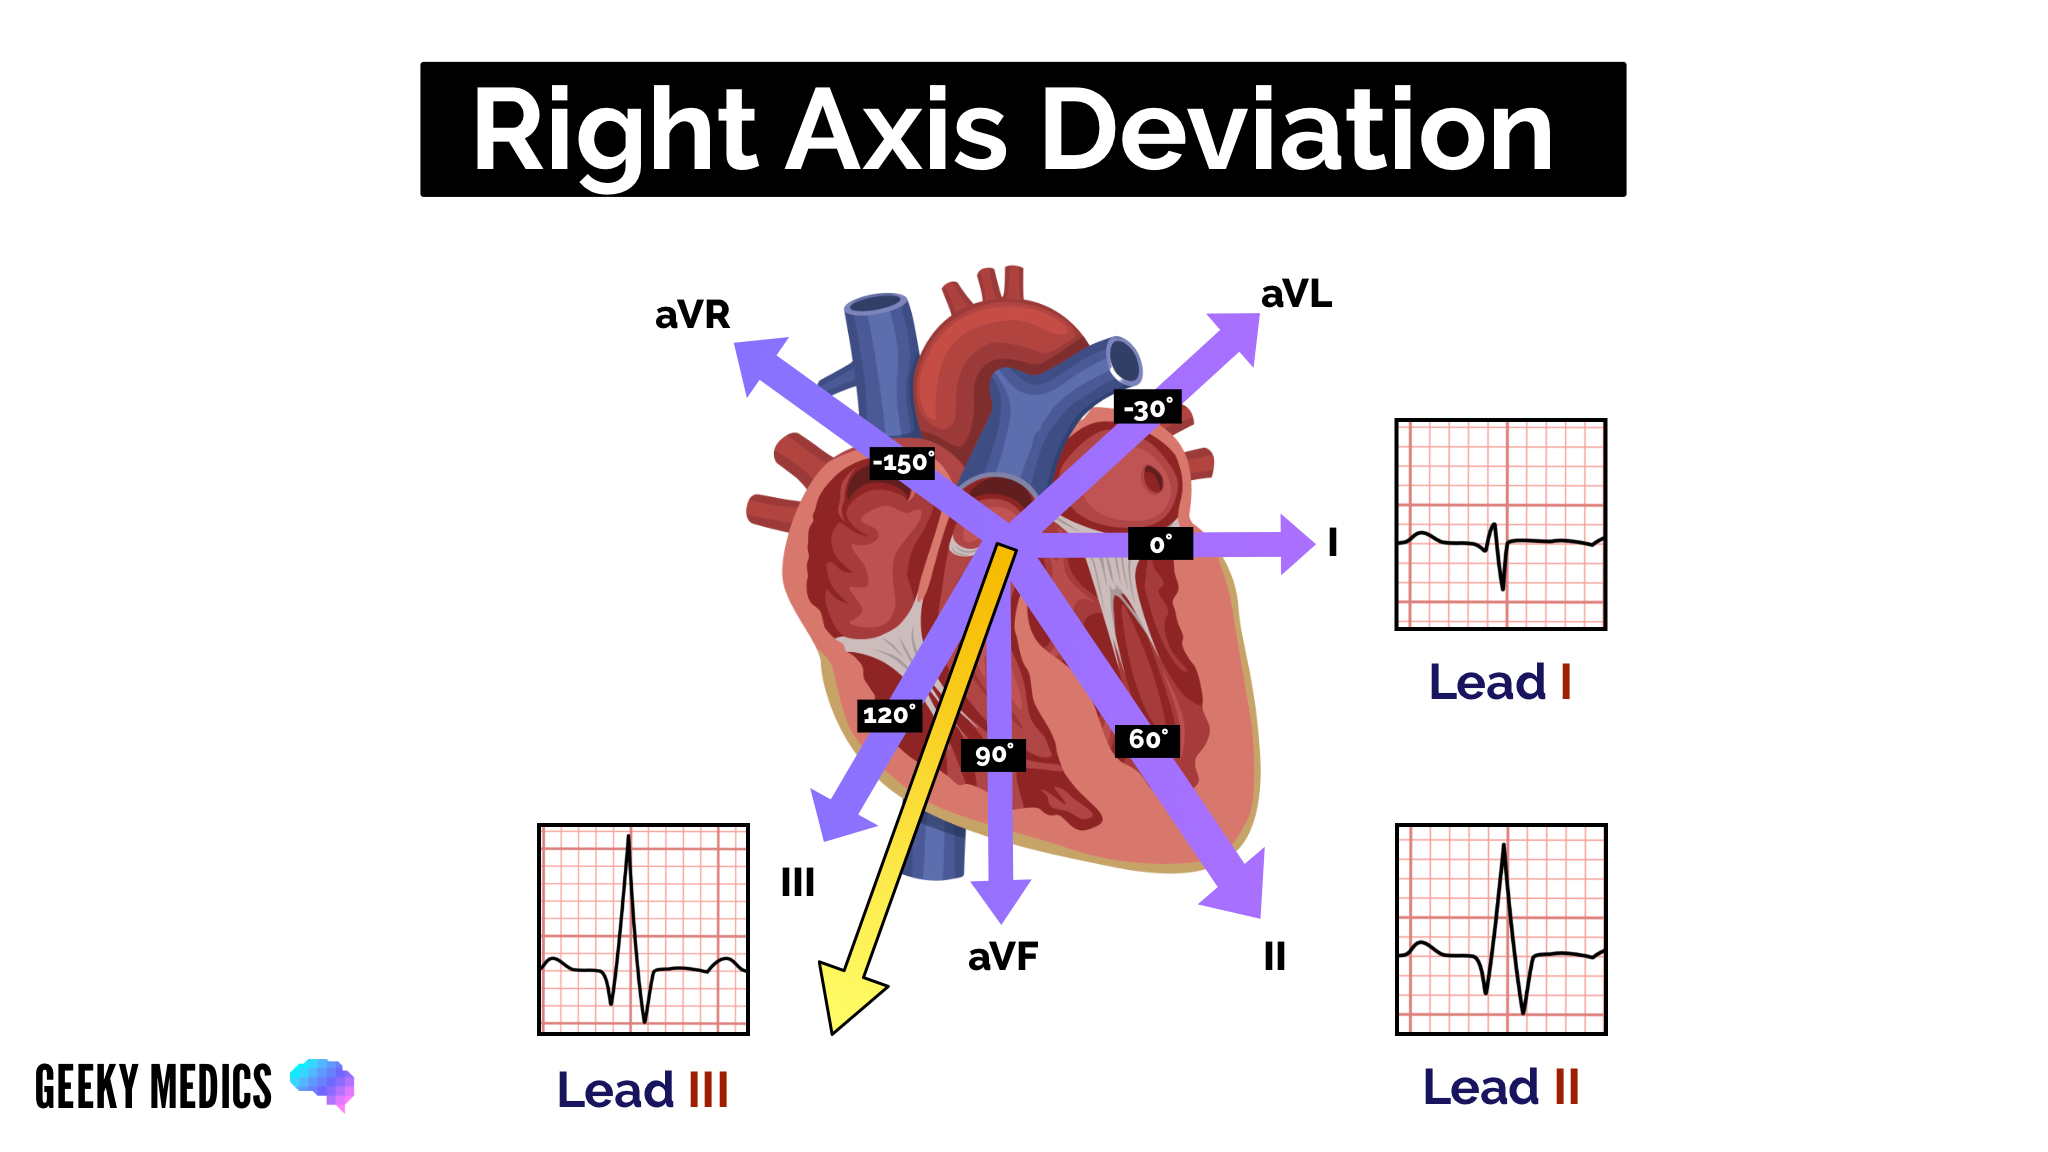
Right axis deviation
Right axis deviation (RAD) involves the direction of depolarisation being distorted to the right (between +90º and +180º).
The most common cause of RAD is right ventricular hypertrophy. Extra right ventricular tissue generates a stronger electrical signal by the right side of the heart. This causes the deflection in lead I to become negative and the deflection in lead aVF/III to be more positive.
RAD is commonly associated with conditions such as pulmonary hypertension, as they cause right ventricular hypertrophy. RAD can, however, be a normal finding in very tall individuals.
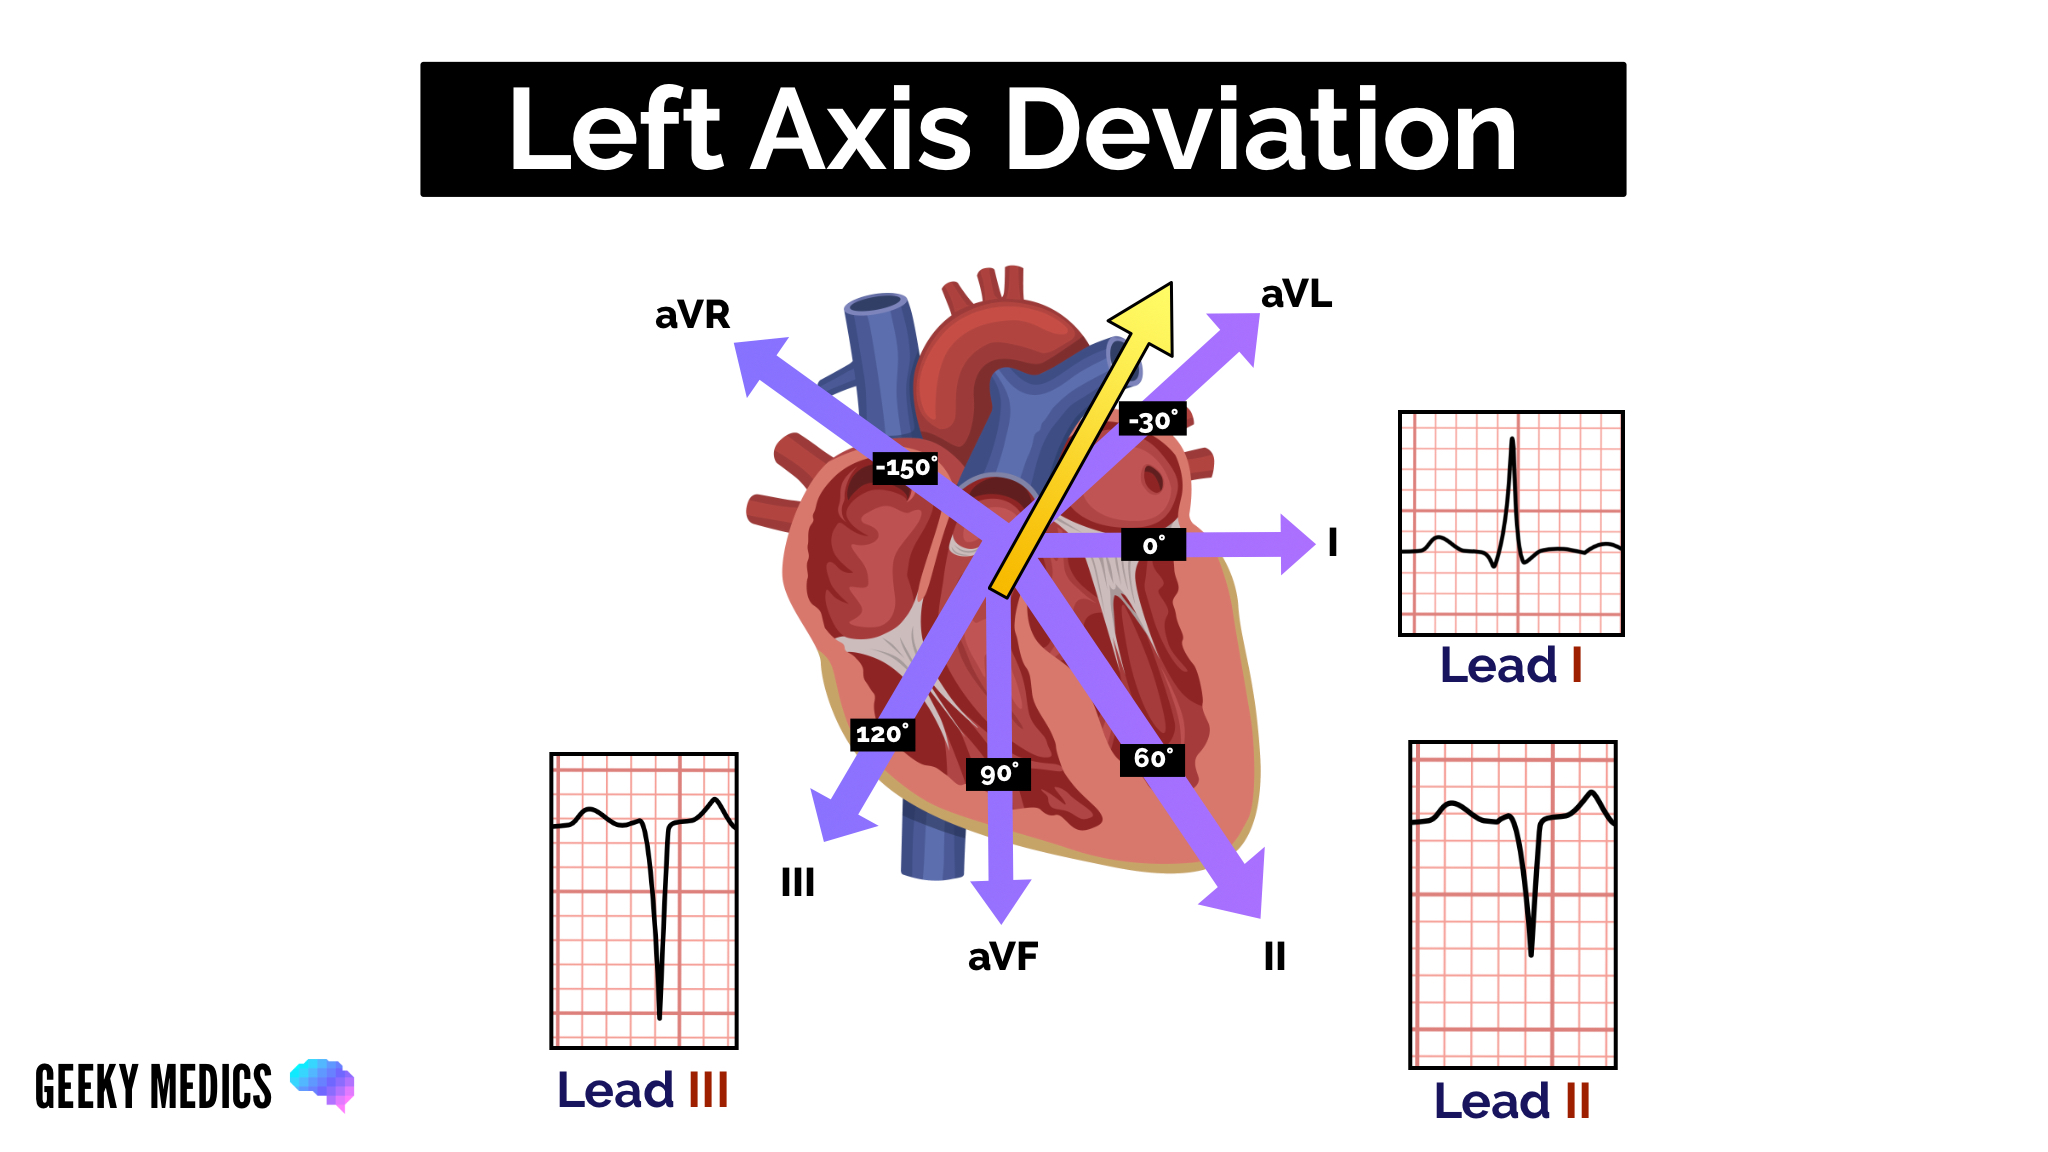
Left axis deviation
Left axis deviation (LAD) involves the direction of depolarisation being distorted to the left (between -30° and -90°). This results in the deflection of lead III becoming negative (this is only considered significant if the deflection of lead II also becomes negative). Conduction abnormalities usually cause left axis deviation.
Want to learn more about ECGs?
We have several other articles relevant to ECGs:
- How to read an ECG: a step by step guide to reading ECGs
- Cardiac axis explained: a simple guide to the cardiac axis
- How to record a 12-lead ECG: an OSCE guide to recording a 12-lead ECG
- How to document an ECG: a guide to documenting your ECG interpretation in the notes
- Bundle branch block: a guide to left and right bundle branch block
Reviewer
Dr Matthew Jackson
Consultant Interventional Cardiologist
Dr Ben Marrow
Cardiology Registrar
