

- 📖 Geeky Medics OSCE Book
- ⚡ Geeky Medics Bundles
- ✨ 1300+ OSCE Stations
- ✅ OSCE Checklist PDF Booklet
- 🧠 UKMLA AKT Question Bank
- 💊 PSA Question Bank
- 💉 Clinical Skills App
- 🗂️ Flashcard Collections | OSCE, Medicine, Surgery, Anatomy
- 💬 SCA Cases for MRCGP
To be the first to know about our latest videos subscribe to our YouTube channel 🙌
This guide provides an overview of jugular venous pressure (JVP) including background physiology, how the JVP should be assessed, causes of a raised JVP and the JVP waveform.
Background
Jugular venous pressure (JVP) provides an indirect measure of central venous pressure. This is possible because the internal jugular vein (IJV) connects to the right atrium without any intervening valves, resulting in a continuous column of blood. The presence of this continuous column of blood means that changes in right atrial pressure are reflected in the IJV (e.g. raised right atrial pressure results in distension of the IJV).
The IJV runs between the medial end of the clavicle and the ear lobe, under the medial aspect of the sternocleidomastoid, making it difficult to visualise (its double waveform pulsation is, however, sometimes visible due to transmission through the sternocleidomastoid muscle).
Because of the inability to easily visualise the IJV, it’s tempting to use the external jugular vein (EJV) as a proxy for assessment of central venous pressure during clinical assessment. However, because the EJV typically branches at a right angle from the subclavian vein (unlike the IJV which sits in a straight line above the right atrium) it is a less reliable indicator of central venous pressure.
 Anterior view of the SVC, EJV and IJV


Why do we assess the JVP?
Assessment of the JVP can provide insight into the patient’s fluid status and central venous pressure. If a patient is hypervolaemic the JVP will appear raised due to increased venous pressure within the right atrium causing a higher than normal column of blood within the IJV.
Differentiating venous and arterial pulsation
When trying to identify the venous pulsation associated with the JVP, it’s important to distinguish it from the arterial pulsation of the nearby carotid artery.
Differences between the venous pulsation of the JVP and the arterial pulsation of the carotid artery include:
- Number of pulses: the JVP has a double waveform pulse (i.e. 2 pulses) whereas the carotid artery has a single pulsation for each cardiac cycle.
- Palpability: the pulse of the JVP is not easily palpable, whereas the carotid pulse is typically easy to feel.
The double waveform pulsation associated with the JVP reflects pressure changes within the right atrium. Think of the pressure changes as a Mexican wave; starting in the right atrium and travelling to the IJV where we observe the pulsations.
How do we assess the JVP?
Assessment of the JVP
1. Position the patient in a semi-recumbent position (at 45°).
2. Ask the patient to turn their head slightly to the left.
3. Inspect for evidence of the IJV, running between the medial end of the clavicle and the ear lobe, under the medial aspect of the sternocleidomastoid (it may be visible just above the clavicle between the sternal and clavicular heads of the sternocleidomastoid). The IJV has a double waveform pulsation, which helps to differentiate it from the pulsation of the external carotid artery.
4. Measure the JVP by assessing the vertical distance between the sternal angle and the top of the pulsation point of the IJV (in healthy individuals, this should be no greater than 3cm).
- Assess the JVP

Hepatojugular reflux test
The hepatojugular reflux test involves the application of pressure to the liver whilst observing for a sustained rise in JVP. This test can be used to further assess the JVP, particularly if you are unsure if the vessel you are observing is the internal jugular vein.
Eliciting hepatojugular reflux
To be able to perform the test, there should be at least a 3cm distance from the upper margin of the baseline JVP to the angle of the mandible:
- Position the patient in a semi-recumbent position (45º).
- Apply direct pressure to the liver.
- Closely observe the IJV for a rise.
- In healthy individuals, this rise should last no longer than 1-2 cardiac cycles (it should then fall).
- If the rise in JVP is sustained and equal to or greater than 4cm this is deemed a positive result.
- This assessment can be uncomfortable for the patient and therefore it should only be performed when felt necessary (an examiner will often prevent you from performing it in an OSCE but you should mention it).
- Assess for hepatojugular reflux

Causes of a raised JVP
A raised JVP indicates the presence of venous hypertension. Cardiac causes of a raised JVP include:
- Right-sided heart failure: commonly caused by left-sided heart failure. Pulmonary hypertension is another cause of right-sided heart failure, often occurring due to chronic obstructive pulmonary disease or interstitial lung disease.
- Tricuspid regurgitation: causes include infective endocarditis and rheumatic heart disease.
- Constrictive pericarditis: often idiopathic, but rheumatoid arthritis and tuberculosis are also possible underlying causes.
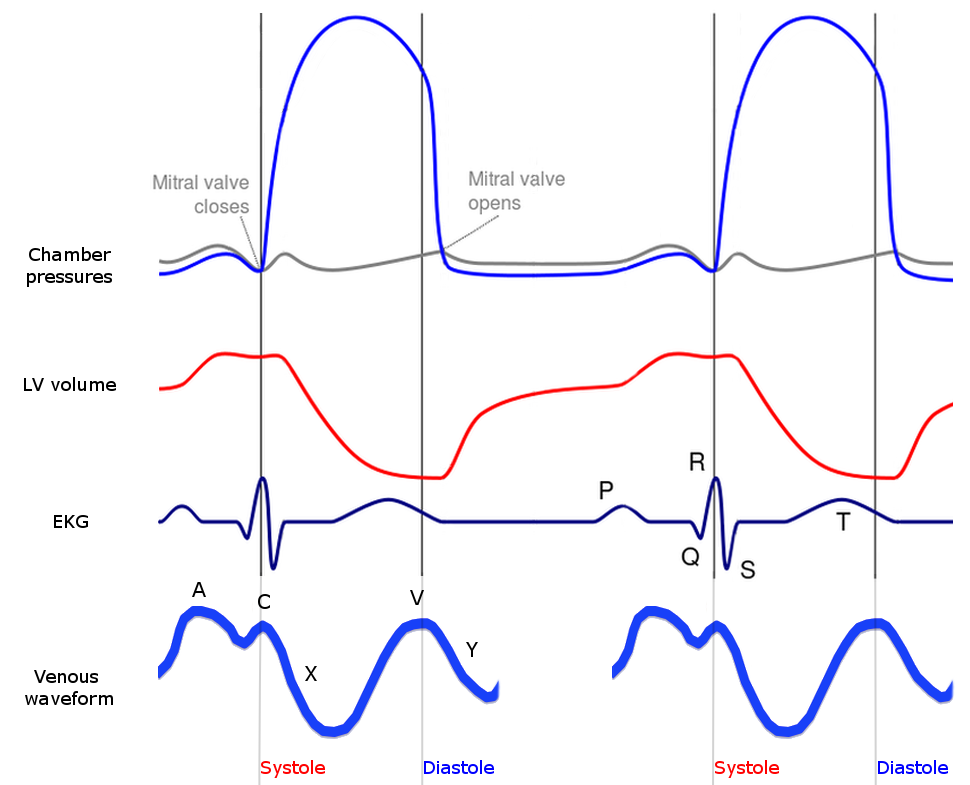
JVP waveform
The JVP has its own waveform which consists of 5 parts:
- A wave
- X descent (part 1)
- C wave
- X descent (part 2)
- V wave
- Y descent
A wave
The A wave is caused by the contraction of the right atrium, where blood is being pumped through the tricuspid valve into the right ventricle. Increased pressure in the right atrium also forces blood upwards towards and into the IJV. This influx of venous blood into the IJV is known as the A wave.
X descent (part 1)
The first part of the X descent is caused by relaxation of the right atrium, which results in blood filling the right atrium from the superior vena cava, reducing the height of the column of blood sitting in the IJV (i.e. causing a drop in the JVP). The right ventricles relaxation also contributes to the X descent, as blood exits the right atrium into the right ventricle, further reducing the column of blood in the SVC and IJV.
C wave
The C wave is caused by the forceful contraction of the right ventricle which ejects blood out of the heart into the pulmonary artery. As this occurs, the pressure within the right ventricle increases significantly, forcing the tricuspid valve upwards so much so that it projects partially into the right atrium. This sudden projection of the tricuspid valve into the right atrium generates upwards force which is transmitted into the SVC and ultimately the IJV, causing a temporary rise in the JVP referred to as the C wave.
X descent (part 2)
The second part of the X descent occurs during the final phase of right ventricular contraction. When the ventricle reaches its most contracted state, it is physically much smaller than when in its relaxed state, resulting in the creation of extra space within the pericardium. This extra space within the pericardium allows the right atrium to expand and begin filling with blood. This initial phase of atrial filling results in a drop in venous pressure within the SVC and IVC, producing the second part of the X descent.
V wave
The V wave is caused by the relaxation of the right atrium whilst the tricuspid valve is still closed. The relaxation of the right atrium combined with a closed tricuspid valve results in blood being drawn into the column of blood that begins at the right atrium and extends up to the IJV. As blood is drawn into the column, whilst the tricuspid valve is closed, the level of the JVP is temporarily increased.
Y descent
The Y descent occurs when the tricuspid valve opens, resulting in blood from the right atrium filling the right ventricle and blood from the SVC and IJV filling the right atrium. This results in a decrease in the height of the column of blood and thus a decrease in the JVP.
References
- Rivard AB, Kortz MW, Burns B. Anatomy, Head and Neck, Internal Jugular Vein. [Updated 2020 May 2]. In: StatPearls [Internet]. Treasure Island (FL): StatPearls Publishing; 2020 Jan-. Available from: [LINK].
- Applefeld MM. The Jugular Venous Pressure and Pulse Contour. In: Walker HK, Hall WD, Hurst JW, editors. Clinical Methods: The History, Physical, and Laboratory Examinations. 3rd edition. Boston: Butterworths; 1990. Chapter 19. Available from: [LINK].
Image references
Figure 1. Nootherone321. Wiggers diagram with jugular venous waveform. License: [CC BY-SA]
