

- 📖 Geeky Medics OSCE Book
- ⚡ Geeky Medics Bundles
- ✨ 1300+ OSCE Stations
- ✅ OSCE Checklist PDF Booklet
- 🧠 UKMLA AKT Question Bank
- 💊 PSA Question Bank
- 💉 Clinical Skills App
- 🗂️ Flashcard Collections | OSCE, Medicine, Surgery, Anatomy
- 💬 SCA Cases for MRCGP
To be the first to know about our latest videos subscribe to our YouTube channel 🙌
Introduction
The heart is the pump of the body’s circulatory system. It must work in a systematic way so that the body is adequately supplied with blood.
This article will give an overview of the cardiac cycle, highlighting the physiology and clinical relevance.
Structure of the heart
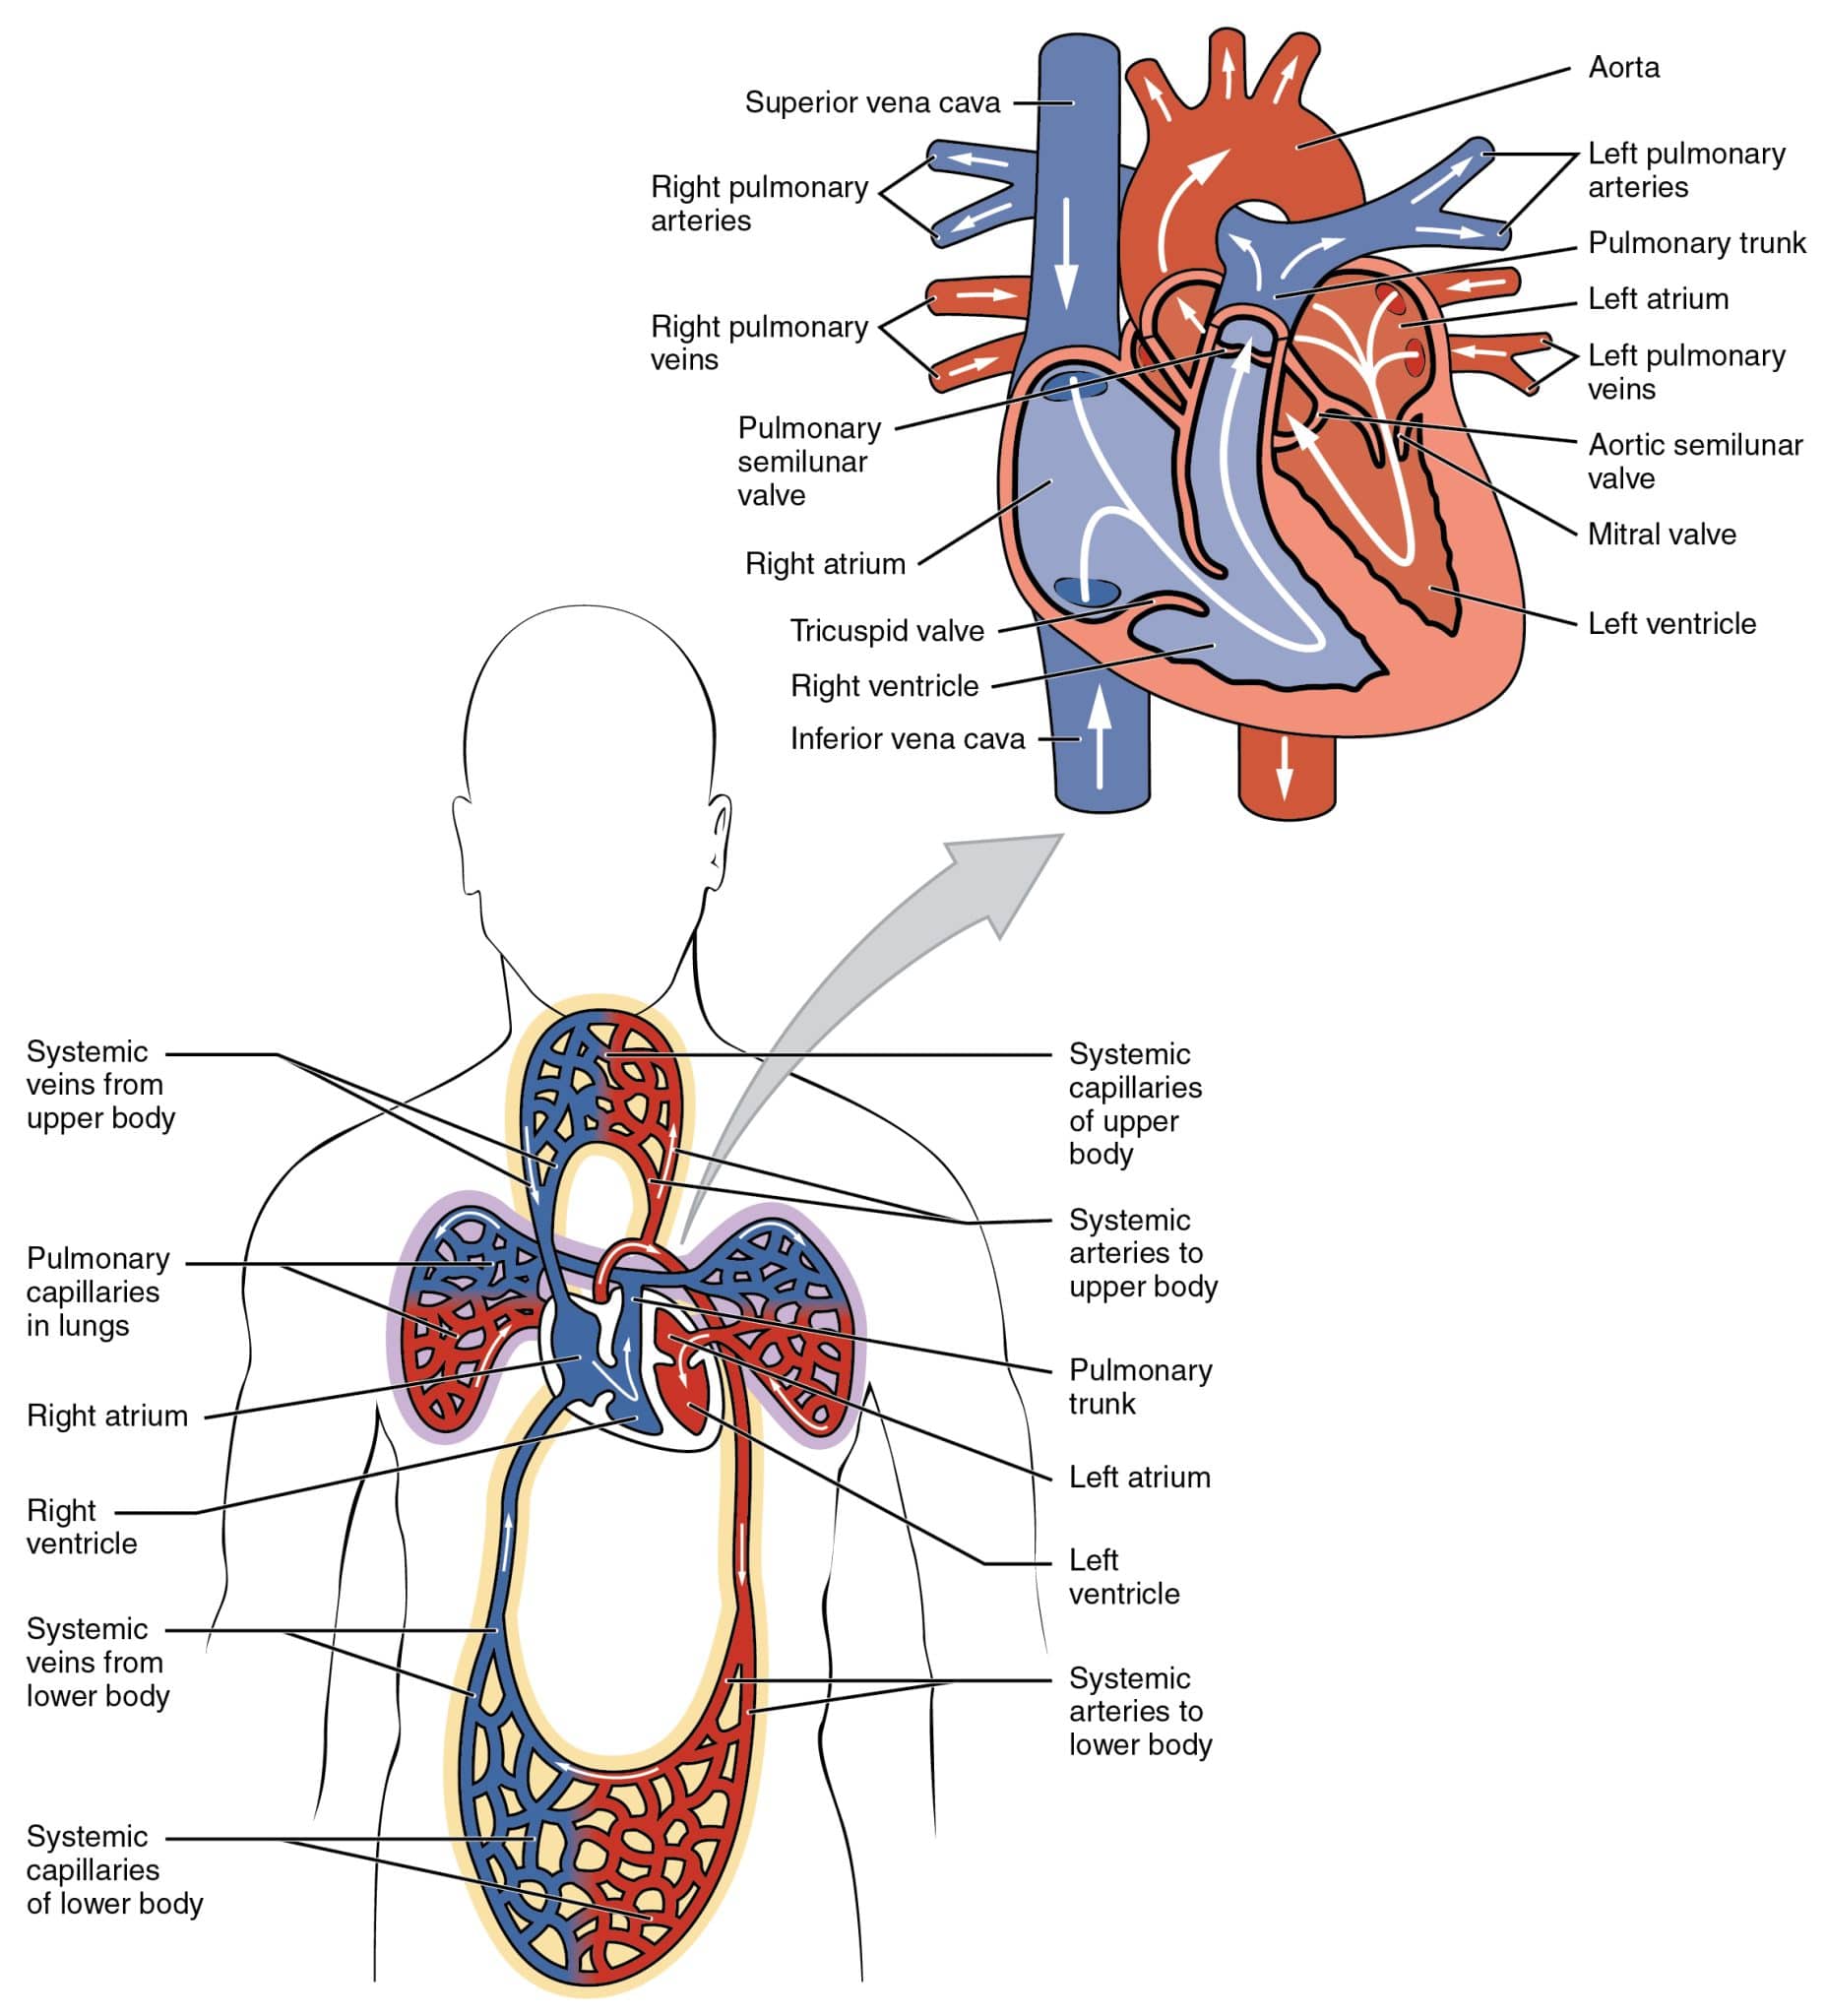
Blood flows through the structures of the heart in the following order:
- Great veins (the venae cavae on the right and the pulmonary vein on the left)
- Atria
- Ventricles
- Great arteries (the pulmonary artery on the right and the aorta on the left)
There are two sets of valves, the atrioventricular and the semilunar valves, on each side of the heart. The valves direct the flow of blood into the next structure and prevent backflow.
The atrioventricular valves connect the atria and ventricles. The tricuspid valve is on the right side of the heart and the mitral (or bicuspid) valve is on the left (Figure 1).
The semilunar valves lie in the arterial outlets, connecting the ventricles to their associated great arteries. The pulmonary valve lies in the pulmonary outlet, on the right, and the aortic valve in the aortic outlet, on the left.
The cardiac cycle
The heart relies on its muscle to contract and relax to pump the blood around the body. The left and right sides of the heart are independent of each other, however, will contract synchronously.
When in a contractile state, this is called systole. When in a relaxed state, this is called diastole.
The cycle can then be divided into three stages:
- Atrial systole: contraction of the atria.
- Ventricular systole: contraction of the ventricles. This follows atrial systole after 0.1-0.2 seconds.
- Diastole: relaxation of both the atria and ventricles.
The valves open when the chamber before it has a higher pressure than the chamber it is leading to. The valves close if the pressure of the chamber before the valve is lower than that of the chamber the blood is flowing through, this is so that blood doesn’t go backwards due to the pressure difference.
During atrial systole, the atrioventricular valves open so that blood can enter the ventricles.
Then, during ventricular systole, the atrioventricular valves shut, and the semilunar valves open so that the blood leaves the heart through the great arteries, rather than re-entering the atria.
The sequential closing of the two sets of the valves makes the characteristic ‘lub-dub’ sound of the heartbeat.
Wigger’s diagram
Wigger’s diagram is used to demonstrate the varying pressures in the atrium, ventricle, and artery during one cardiac cycle (Figure 2).
Intracardiac pressures are different within the right and left sides of the heart. The left side has higher pressure, as it has to pump blood through the whole body, compared to the right side, which has to pump blood through the lungs only. However, the diagram of each side would demonstrate the same shape.
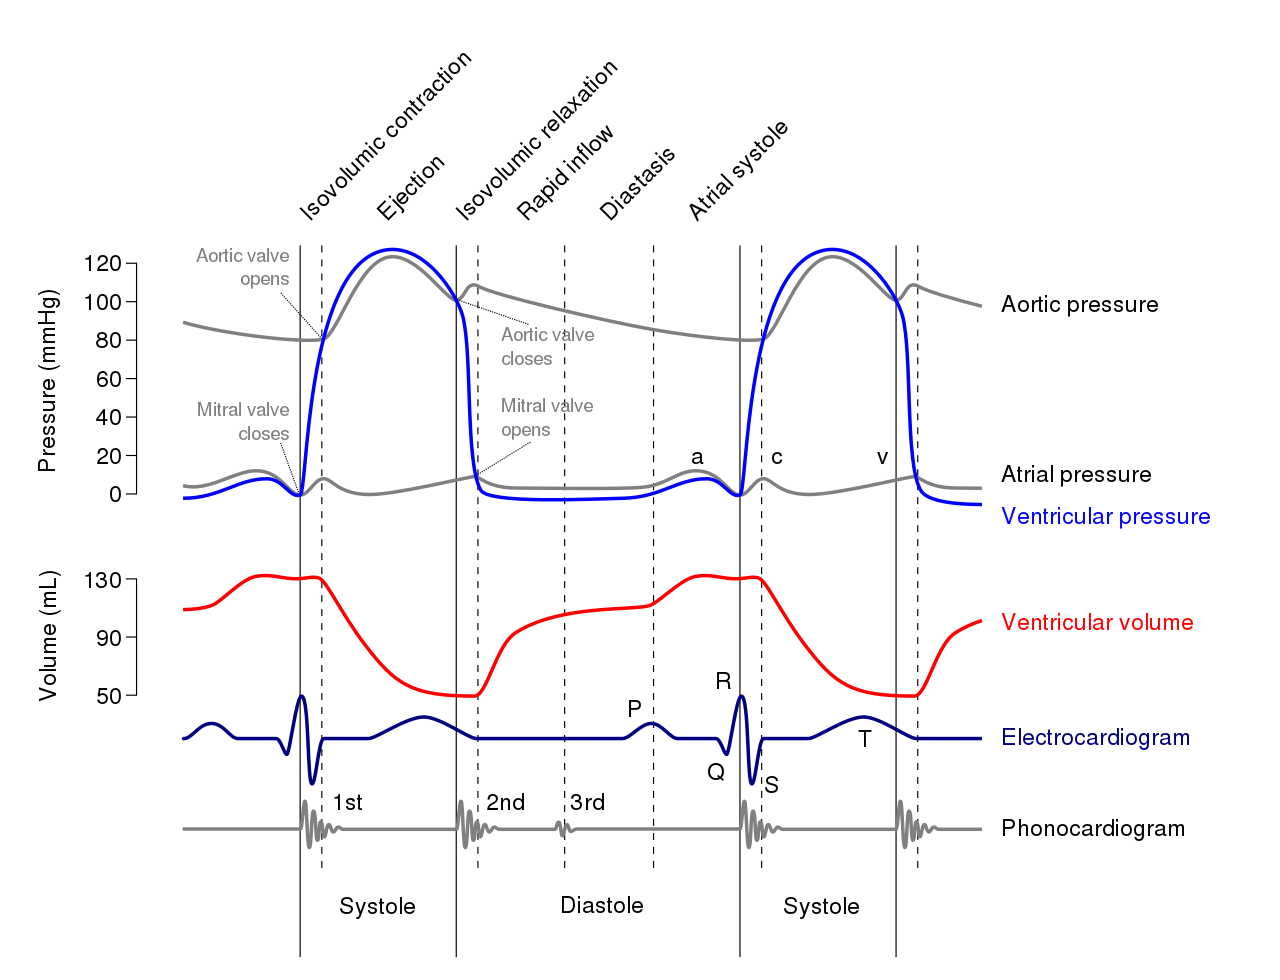
The graph can be split into four sections.
Atrial systole

In atrial systole:
- Atrial pressure increases as the atria contract.
- Ventricular pressure increases slightly (and in proportion to the atria) as blood from the atria enters the ventricles.
- Ventricular pressure rises to a pressure greater than the atrial pressure causing the atrioventricular valve to shut. This produces the first heart sound (S1).
Ventricular systole (isovolumetric contraction)
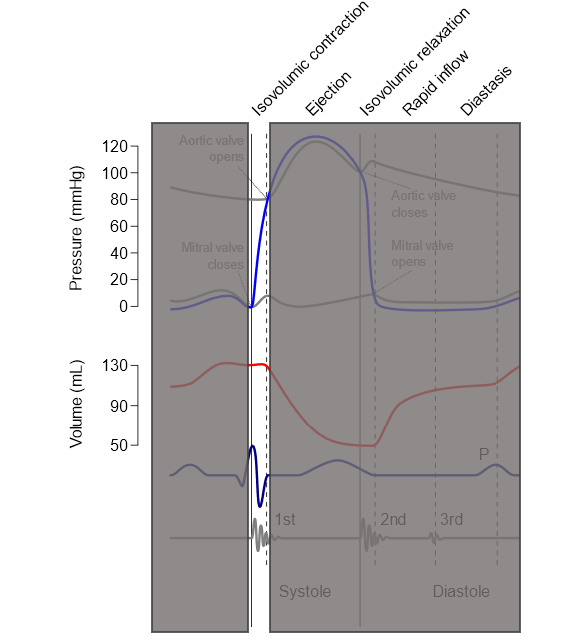
In ventricular systole (isovolumetric contraction):
- Ventricular pressure increases as the ventricles contract.
- Both the mitral and aortic valves are shut so the volume of the ventricle stays the same whilst the ventricle contracts, therefore this stage is called an isovolumetric contraction.
- Ventricular pressure increases to a point where it becomes equal to the arterial pressure, causing the aortic valve to open.
Ventricular systole (ejection phase)
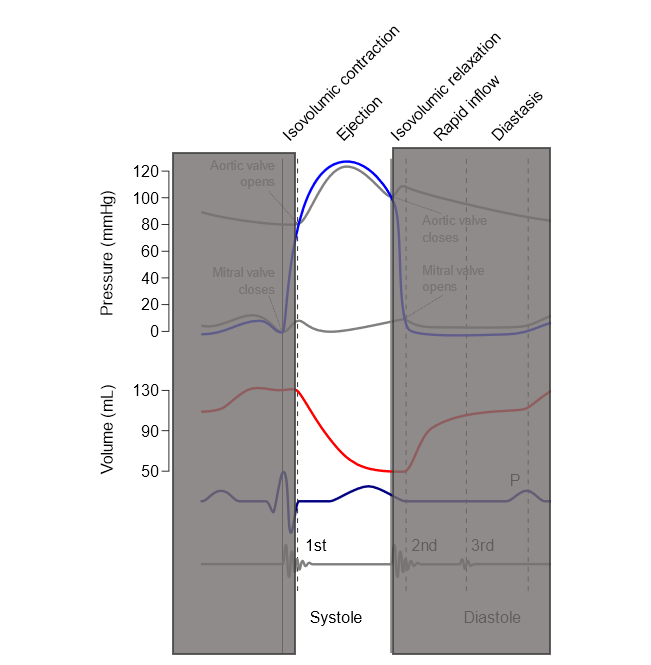
In ventricular systole (ejection phase):
- Ventricular pressure continues to rise as the ventricles continue to contract until it reaches a peak.
- During this phase, blood is ejected from the heart (hence why it is called the ejection phase).
- Arterial pressure increases as blood enters the aorta from the ventricles and the aorta contracts to pump blood around the body.
- Ventricular and arterial pressures decrease after reaching a peak as blood is leaving them.
- Ventricular pressure falls lower than arterial pressure, at which point the aortic valve will close. This produces the second heart sound (S2).
Diastole
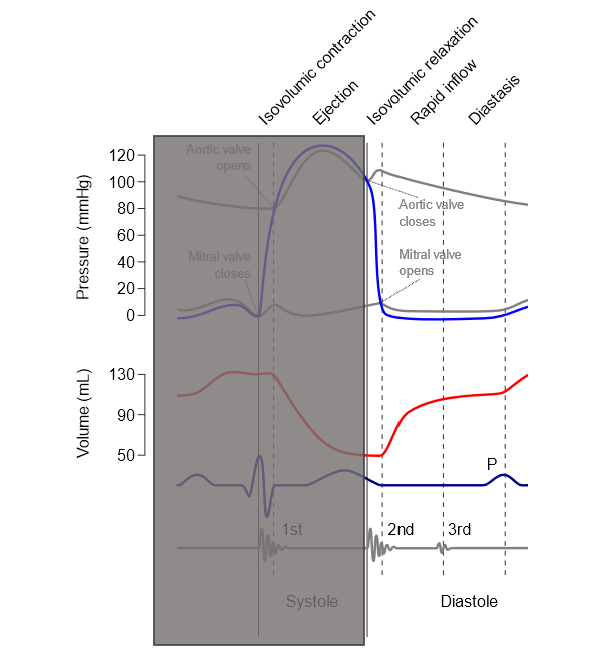 Figure 6. Wigger’s diagram: highlighting the diastolic phase.
In diastole:
- Both aortic and mitral valves are shut, so the volume of the ventricles is constant whilst they relax. Therefore, this stage is called an isovolumetric relaxation.
- When the ventricular pressure falls below the atrial pressure, the mitral valve will open.
- Atrial and ventricular pressure initially drops slightly, but as the blood enters the atria, pressures start to rise again due to diastolic filling.
The next cycle then starts when the atria contract.
Clinical relevance: Heart murmurs
Valvular incompetence causes the occurrence of abnormal heart sounds, also known as heart murmurs. This can occur if the valve is ‘leaky’ (known as regurgitation) or is narrowed (known as stenosis).
The murmur is classed as either systolic or diastolic.
They are further classified according to when in the cardiac cycle they are heard:
- Ejection systolic murmur: the beginning of the systolic phase
- Late-systolic murmur: end of the systolic phase
- Pansystolic murmur: throughout the systolic phase
- Diastolic murmur: during the diastolic phase
Cardiac volumes
There are two cardiac volumes to be measured during the cardiac cycle.
- Ventricular end-systolic volume = the volume of blood in the ventricle at the end of the systolic phase
- Ventricular end-diastolic volume = the volume of blood in the ventricle at the end of the diastolic phase
These volumes can then be used to calculate other parameters which are indicative of cardiac function.
Stroke volume
This is the volume of blood that is ejected from the heart in one cardiac cycle. This is calculated by:
Cardiac output
This is the total volume of blood that is pumped through the heart in a minute. This is calculated by:
Ejection fraction
This demonstrates the percentage of blood the heart receives that is ejected during systole. This is calculated by:
Key points
- The cardiac cycle can be divided into systolic (contraction) and diastolic (relaxation) phases.
- The cycle goes in the following order: atrial systole, ventricular systole and diastole.
- Heart valves open when the pressure of the chamber lying before it is higher than that of the chamber after the valve.
- The shutting of the valves produces the two heart sounds (S1/S2), also known as the ‘lub-dub’ heart sounds.
- Wigger’s diagram helps to demonstrate the pressure changes that occur in the heart during one cardiac cycle.
- Valvular incompetence causes heart murmurs, which are heart sounds produced outside of the classic ‘lub-dub’ rhythm.
- Important cardiac parameters can be calculated using ventricular end-systolic and end-diastolic volumes.
- Cardiac parameters that can be calculated to determine cardiac function include stroke volume, cardiac output and ejection fraction.
Reviewer
Mr Sunil Bhudia
Consultant Cardiothoracic Surgeon
Editor
Dr Chris Jefferies
References
Reference texts
- Gillian Pocock, Christopher D. Richards, David A. Richards. Human Physiology (Fifth Edition). 2018.
- Walter F. Boron, Emile L. Boulpaep. Medical Physiology (Third Edition). 2017.
Reference images
- Figure 1. OpenStax. Dual System of the Human Blood Circulation. License: [CC BY 4.0]
- Figure 2 – 6. DanielChangMD. Adapted by Geeky Medics. Wigger’s diagram. Licence: [CC BY-SA 2.5]
