- 📖 Geeky Medics OSCE Book
- ⚡ Geeky Medics Bundles
- ✨ 1300+ OSCE Stations
- ✅ OSCE Checklist PDF Booklet
- 🧠 UKMLA AKT Question Bank
- 💊 PSA Question Bank
- 💉 Clinical Skills App
- 🗂️ Flashcard Collections | OSCE, Medicine, Surgery, Anatomy
- 💬 SCA Cases for MRCGP
To be the first to know about our latest videos subscribe to our YouTube channel 🙌
Growth charts are an important tool used to compare the growth of an individual to the growth of a normal population (the reference population). Thus, they may be used to define the abnormal growth of a child and track their progress through time.
The current UK-WHO growth charts combine World Health Organisation standards with UK preterm and birth data to depict a healthy pattern of growth that is desirable for all children, whether breastfed or formula-fed and of whatever ethnic origin.
The growth chart used to plot the measurements of weight, height/length and head circumference should correspond to the child’s sex and age. See the paediatric growth assessment guide for instructions on taking these measurements.
RCPCH growth charts
Copies of the NHS and RCPCH approved growth charts are available online:
0-4 years
2-18 years
Neonatal and infant close monitoring (NICM)
Plotting
0-4 years
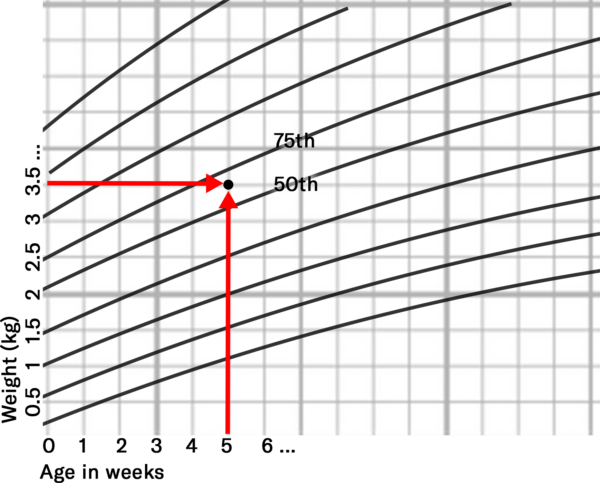
For babies born at term (>/= 37 weeks), plot each measurement on the relevant chart by drawing a small dot where a vertical line through the child’s age crosses a horizontal line through the measured value – height/length, weight or head circumference (see Fig. 1 below).
Plot birth weight/length/head circumference at age 0.
For pre-term infants
If <32 weeks gestation – the NICM chart should be used.
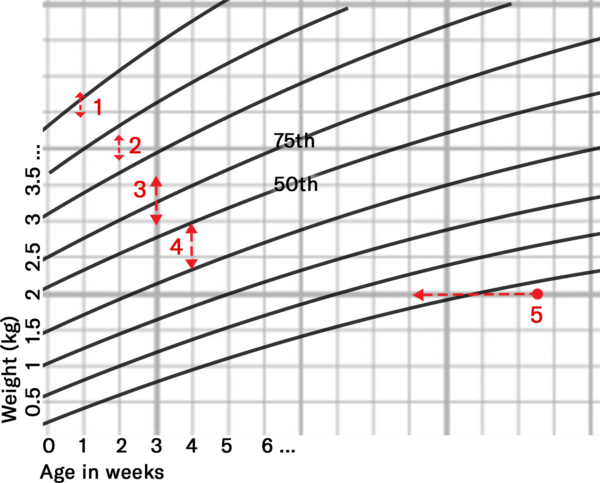
If >32 weeks and before 37 weeks, plot all measurements in the preterm section until 42 weeks gestation. Then plot on the 0-1-year chart using gestational correction as shown in Fig. 2 (below).
Gestational correction: plot measurements at the child’s actual age, then draw a line back the number of weeks the infant was preterm. Mark the spot with an arrow: this is child’s gestationally corrected centile. This should continue until at least 1 year of age.
2-18 years
Plot each measurement on the relevant chart by drawing a small dot where a vertical line through the child’s age crosses a horizontal line through the measured value – height or weight (see Fig. 1 below).

Centile terminology
Below is a summary of some of the key points you should understand when it comes to centiles, with an included chart that illustrates each of the points:
- If the point is within 1/4 of a space of the line, they are on the centile (i.e. 91st).
- If not, they should be described as being between the two centiles (i.e. 75th-91st).
- A centile space may be considered the equivalent distance if midway between centiles.
- A centile space may also be considered the distance between two of the centile lines.
- Plotting for PRE-TERM INFANTS: Draw a line back the number of weeks preterm and mark with an arrow (Dot = actual age / Arrow = gestational age).

Percentiles
Growth charts indicate:
- A child’s size compared with children of the same age and maturity who have shown optimal growth.
- How quickly a child is growing.
Centile lines show the expected range of weights and heights (or lengths). They describe the number of children expected to be BELOW that line (i.e. 50% below the 50th, 91% below the 91st):
- 99 out of 100 children who are growing optimally will be between the two outer lines (0.4th – 99.6th centiles).
- Half will lie between the 25th and 75th centile lines.
Babies do not all grow at the same rate – so a baby’s weight often does not follow a particular centile line. Most likely, the weight will track within one centile space (Fig. 1). Acute illness can lead to sudden weight loss and a weight centile fall, but children generally recover to their normal centile within 2-3 weeks.
A sustained drop through two or more weight centiles is unusual and should be investigated.
Healthy children generally show a stable average height/length position over time.
After 6 weeks of age, a head circumference below the 2nd centile will be seen in only 1 in 250 children and should be investigated. Furthermore, a head circumference above the 99.6th centile, or crossing upwards through 2 centile spaces should only be cause for concern if there is continued rise after 6 months, or other signs and symptoms (i.e. irritability, vomiting, full or bulging fontanelle, persistent downwards gaze).
Between 2-18 years – Further assessment is required with any of the following:
- Weight or height or BMI is below the 0.4th centile (unless already fully investigated at an earlier age).
- The height centile is more than 3 centile spaces below the mid-parental centile (see below).
- A drop in the height centile position of more than 2 centile spaces.
- Any other concerns about the child’s growth.
Mid-parental centile & adult height predictor charts
Mid-parental centile
The mid-parental centile is the average adult height centile to be expected for all children of these particular parents.
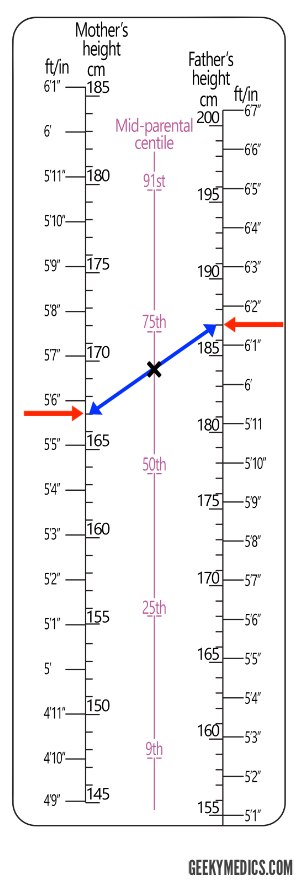
The scale is located on the right-hand side of the chart (Fig. 3).
Calculating the mid-parental centile
If possible, measure both the parent’s heights. If not available, use reported heights.
Mark their heights on the relevant Mother and Father scales.
Join the two points with a line between them. The mid parental centile is where this line crosses the centile line in the middle.
Interpreting the mid-parental centile
Compare the mid-parental centile to the child’s current height centile (this may help assess whether the child’s growth is proceeding as expected).
If a large discrepancy exists between the mid-parental centile to the child’s current height centile, the more likely it is that the child has some sort of growth disorder.
9 out of 10 children’s height centiles are within +/- 2 centile spaces of the mid-parental centile.

Adult height predictor chart
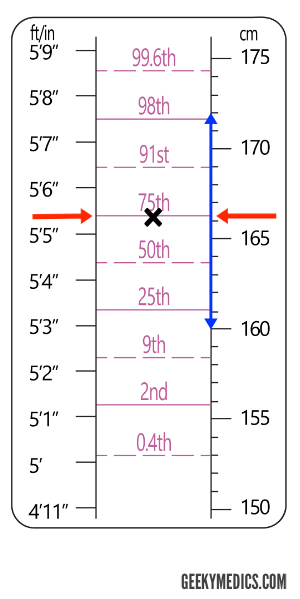
The adult height predictor chart (Fig. 4) allows for a prediction of the child’s adult height based on their current height (adjusted to allow for very tall and short children to be less extreme as adults).
Predicting a child’s adult height
- Plot the most recent height centile on the centre line and read off the predicted adult height for this centile.
- 80% of children will be within +/- 6cm of this value as adults.

Pubertal assessment
The 2-18 years growth chart contains puberty lines from age 8 to 18 years old for girls and 9 to 18 years old for boys.
These lines indicate the normal age limits for the phases of puberty.
Girls
|
Pre-puberty Tanner stage 1 |
In puberty Tanner stage 2 & 3 |
Completing puberty Tanner stage 4 & 5 |
| No signs of pubertal development. | Any breast enlargement, pubic or armpit hair. | Started periods with signs of pubertal development. |
Interpretation
Puberty before 8 years old in girls is likely to be precocious and further investigation is necessary.
If a patient is between 8-13 years old and is plotting within the shaded area of the chart for their height centile, pubertal assessment is required, and mid-parental centile should be assessed.
- If they are “In puberty” or “Completing puberty” – they are BELOW the 0.4th centile and should be referred for further investigation.
- If “Pre-pubertal”, they are generally growing normally but should be compared to their mid-parental centile.
If there are no signs of puberty by 13 years of age, then puberty is delayed and further assessment is indicated.
If the patient is older than 16 years old and not in the “completing puberty stage”, maturation is delayed, and further investigation is required.
Boys
|
Pre-puberty Tanner stage 1 |
In puberty Tanner stage 2 & 3 |
Completing puberty Tanner stage 4 & 5 |
|
If both of the following:
|
If any of the following:
|
If any of the following:
|
Interpretation
Puberty before the age of 9 years in boys is likely to be precocious and further investigation is necessary.
If a patient is between 9-14 years old and is plotting within the shaded area of the chart for their height centile, pubertal assessment is required and mid-parental centile should be assessed.
- If they are “In puberty” or “Completing puberty” – they are BELOW the 0.4th centile and should be referred for further investigation.
- If “Pre-pubertal”, they should be referred for further investigation and compared to their mid-parental centile. After investigation, these children are often found to be growing normally.
If there are no signs of puberty by 14 years of age, then puberty is delayed and further assessment is indicated.
If the patient is older than 17 years old and not in the “completing puberty stage”, maturation is delayed, and further investigation is required.
BMI centiles
The growth charts also provide an opportunity to calculate the child’s BMI from the age of 2.
Both 0-4 years (boys & girls) and 2-18 years (boys & girls) charts provide a simple graph to convert the child’s weight centile and height centile to their BMI centile.
Interpretation
A child whose weight is average for their height will have a BMI between the 25th and 75th centiles, whatever their height centile.
A BMI above the 91st centile suggests the child is overweight.
A BMI above the 98th centile is very overweight (clinically obese).
A BMI below the 2nd centile is unusual and may reflect undernutrition requiring further investigation. In older children, this may simply reflect a small build.
Growth charts for children with Down syndrome
The Down Syndrome Medical Interest Group (DSMIG) and RCPCH have developed cross-sectional growth charts for boys and girls with Down syndrome for use from term to 18 years old.
Reasons for using these charts include:
- Short stature is a recognised characteristic of most people with Down syndrome – the average height at most ages is around the 2nd centile for the general population.
- These children are at increased risk of additional medical conditions that may interfere with growth (e.g. congenital cardiac disease, sleep-related upper airway obstruction, coeliac disease, feeding issues and thyroid hormone deficiency).
- Regular measurements in combination with a general health assessment, nutritional and thyroid status are likely to be sensitive initial indicators of such medical problems, allowing for early intervention.
Reviewer
Dr Sunil Bhopal
Senior Paediatric Registrar
References & further reading
- COI (2009). Using the new UK–World Health Organization 0–4 years growth charts. Department of Health. Accessed 29 Mar 2019. Available from: [LINK].
- Health Policy team (2012). UK Growth chart 0-4 years. RCPCH. Accessed 28 Mar 2019. Available from: [LINK].
- Health Policy team (2012). UK Growth chart 2-18 years. RCPCH. Accessed 28 Mar 2019. Available from: [LINK].
- RCPCH/DSMIG Down syndrome growth chart steering group (2012). The 2011 DSMIG/RCPCH growth charts for children with Down syndrome – Fact sheet. DSMIG. Accessed 28 Mar 2019. Available from: [LINK].


