

- 📖 Geeky Medics OSCE Book
- ⚡ Geeky Medics Bundles
- ✨ 1300+ OSCE Stations
- ✅ OSCE Checklist PDF Booklet
- 🧠 UKMLA AKT Question Bank
- 💊 PSA Question Bank
- 💉 Clinical Skills App
- 🗂️ Flashcard Collections | OSCE, Medicine, Surgery, Anatomy
- 💬 SCA Cases for MRCGP
To be the first to know about our latest videos subscribe to our YouTube channel 🙌
This guide provides a structured approach to interpreting an audiogram (hearing test) in an OSCE setting.
What is an audiogram?
An audiogram is a hearing test conducted under ideal listening conditions in a soundproof booth.
The test includes different pitches and intensities, with the results conveyed in graphical form. If there is hearing loss, an audiogram helps distinguish conductive loss (outer/middle ear) from sensorineural loss (cochlea/cochlear nerve).1
As well as differentiating hearing loss (conductive vs sensorineural), specific patterns seen on audiograms can aid in identifying the underlying cause of the hearing loss.
Interpreting an audiogram
Blank audiogram
A standard audiogram ranges from -10 decibels at the top of the y-axis to 120dB at the bottom of the y-axis (from very quiet to very loud). The x-axis ranges from 125 Hz to 8000 Hz (low pitch to high pitch).
Audiograms use different symbols (as shown in the key below) to differentiate between the ears and to differentiate between air and bone conduction.
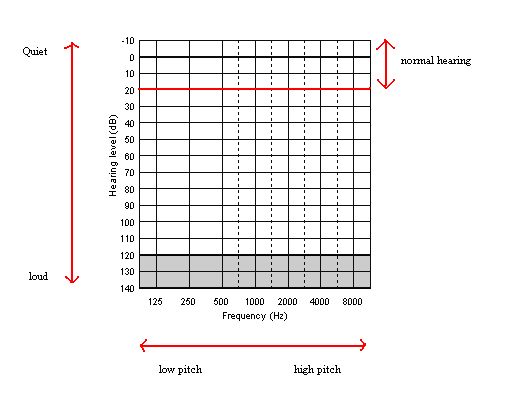
X-axis: frequency in Hertz (pitch)
Y-axis: hearing levels in decibels (loudness)
Audiogram key
Air conduction
- O = Right ear unmasked
- △ = Right ear masked
- X = Left ear unmasked
- ▢ = Left ear masked
Bone conduction
- < = Right ear unmasked
- [ = Right ear masked
- > = Left ear unmasked
- ] = Left ear masked
Clinical masking in audiology refers to introducing noise to the non-test ear during a pure-tone audiogram. This aims to ensure that the test ear hears the presented tone and is not ‘cross-heard‘ by the non-test ear.3
Hearing thresholds
- Normal hearing: can hear quiet sounds of less than 20dB
- Mild hearing loss: hearing loss between 20 – 40dB
- Moderate hearing loss: hearing loss between 41 – 70dB
- Severe hearing loss: hearing loss between 71 – 95dB
- Profound hearing loss: hearing loss over 95dB
Air-bone gap
An air-bone gap (ABG) is defined as the difference between air-conduction and bone-conduction audiometric thresholds.
ABGs are found in patients with conductive (CHL) or mixed (MHL) hearing loss generally attributed to outer- and/or middle-ear diseases such as otitis externa, tympanic membrane perforation, interruption or fixation of the ossicular chain, and chronic suppurative otitis media.4
Typically an air-bone gap is considered if there is a difference of greater than 10dB at a given frequency.
Examples of common audiograms
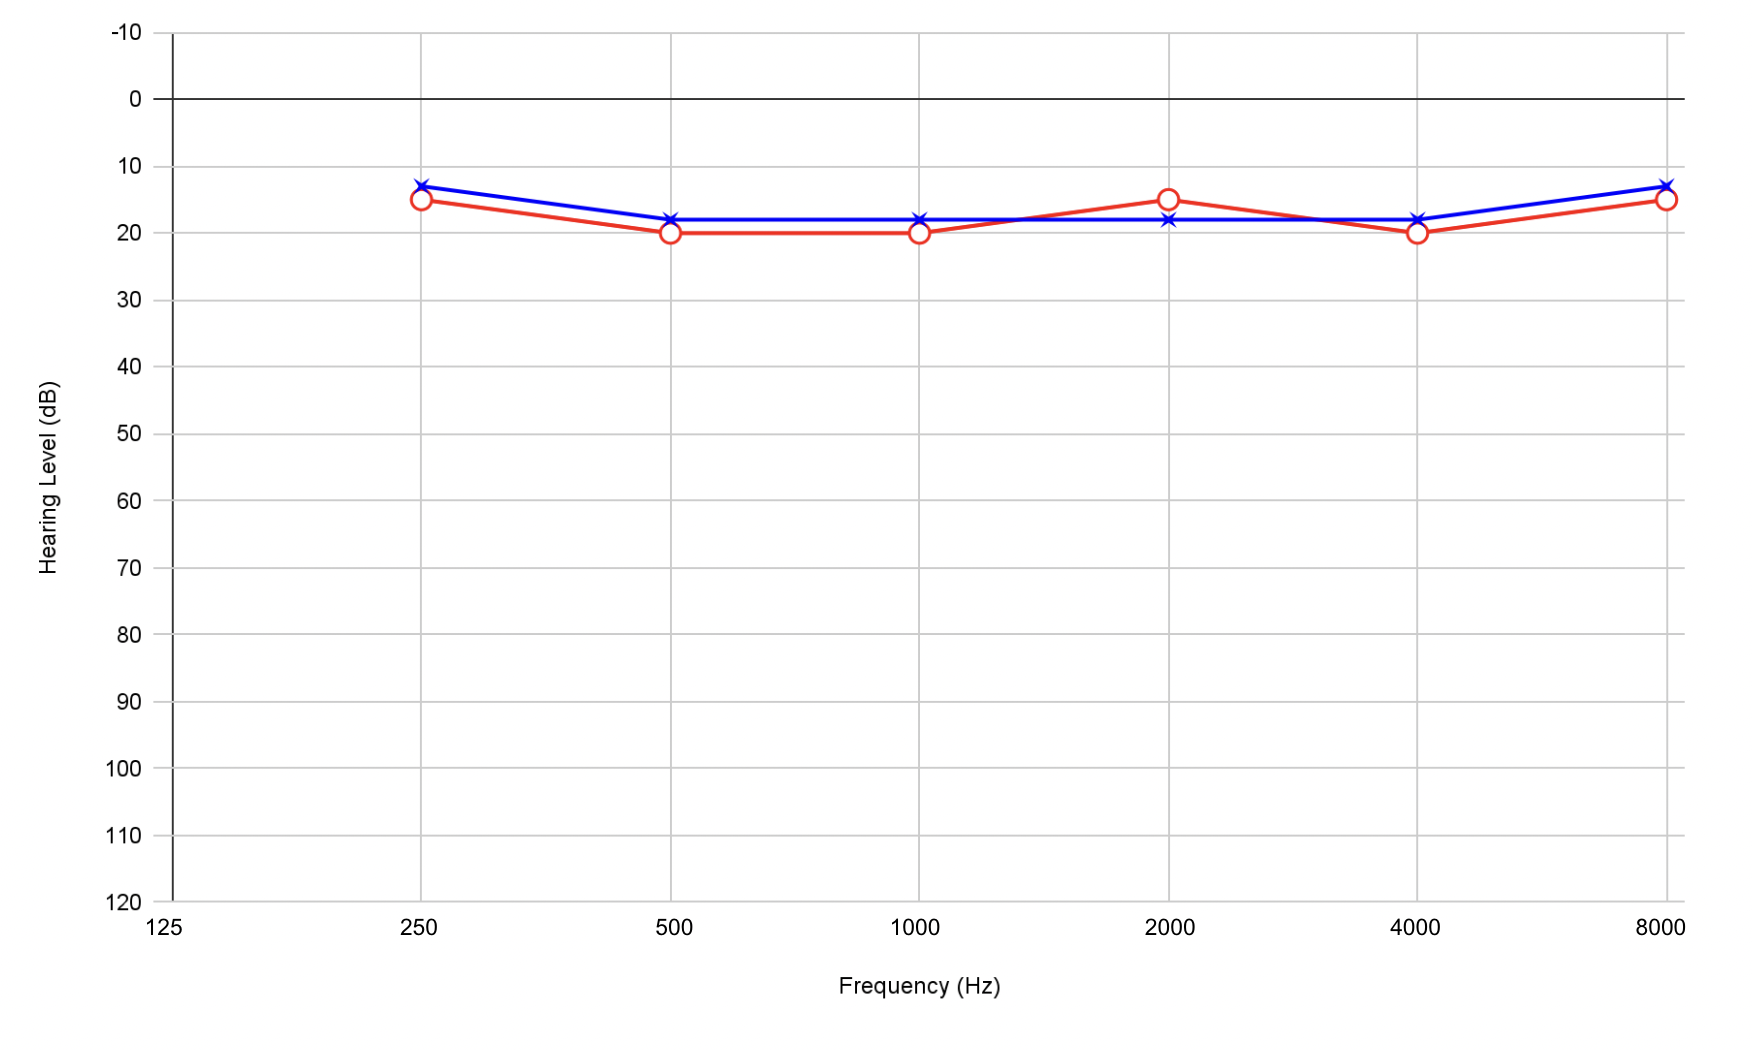
Normal audiogram (above 20dB in all frequencies)
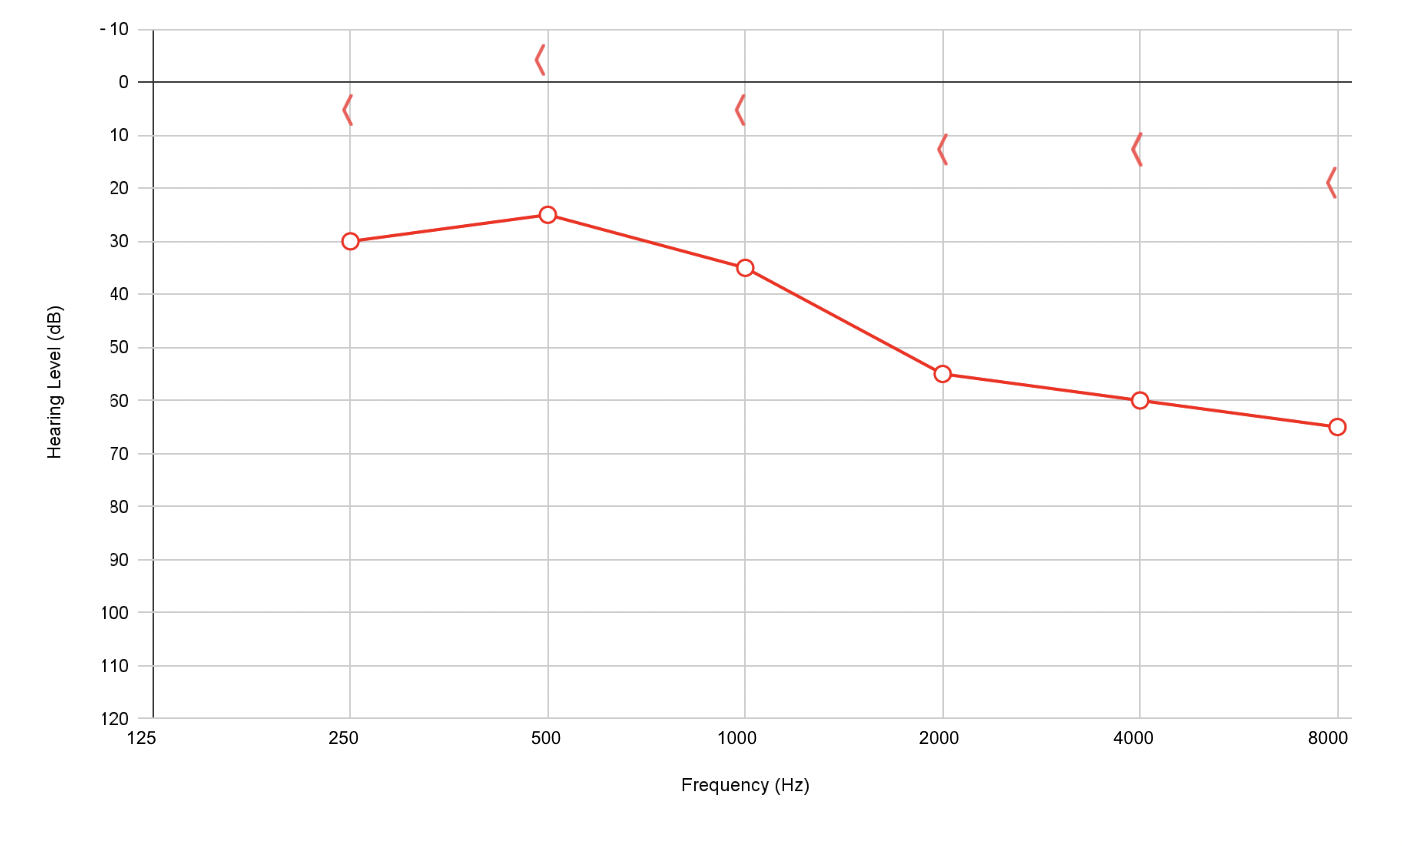
Sensorineural hearing loss (right ear): no air-bone gap present
Sensorineural hearing loss refers to hearing loss due to damage to the structures of the inner ear (cochlea) or cochlear nerve.

Common causes of sensorineural hearing loss include:
- Sudden sensorineural hearing loss (SSHL): the underlying aetiology remains unclear but is thought to relate to possible vascular, viral, inflammatory or immune-mediated causes
- Noise-induced hearing loss
- Presbyacusis
- Vestibular schwannoma
Conductive hearing loss (right ear): air-bone gap present
Conductive hearing loss refers to hearing loss due to impaired sound transmission through the outer and middle ear.
Common causes of conductive hearing loss include:
- Any obstruction to the ear canal (e.g. wax, foreign body, furuncle, oedema)
- Perforation of tympanic membrane
- Fluid in the middle ear (e.g. glue ear, otitis media)
- Any disruption of ossicles (e.g. trauma)
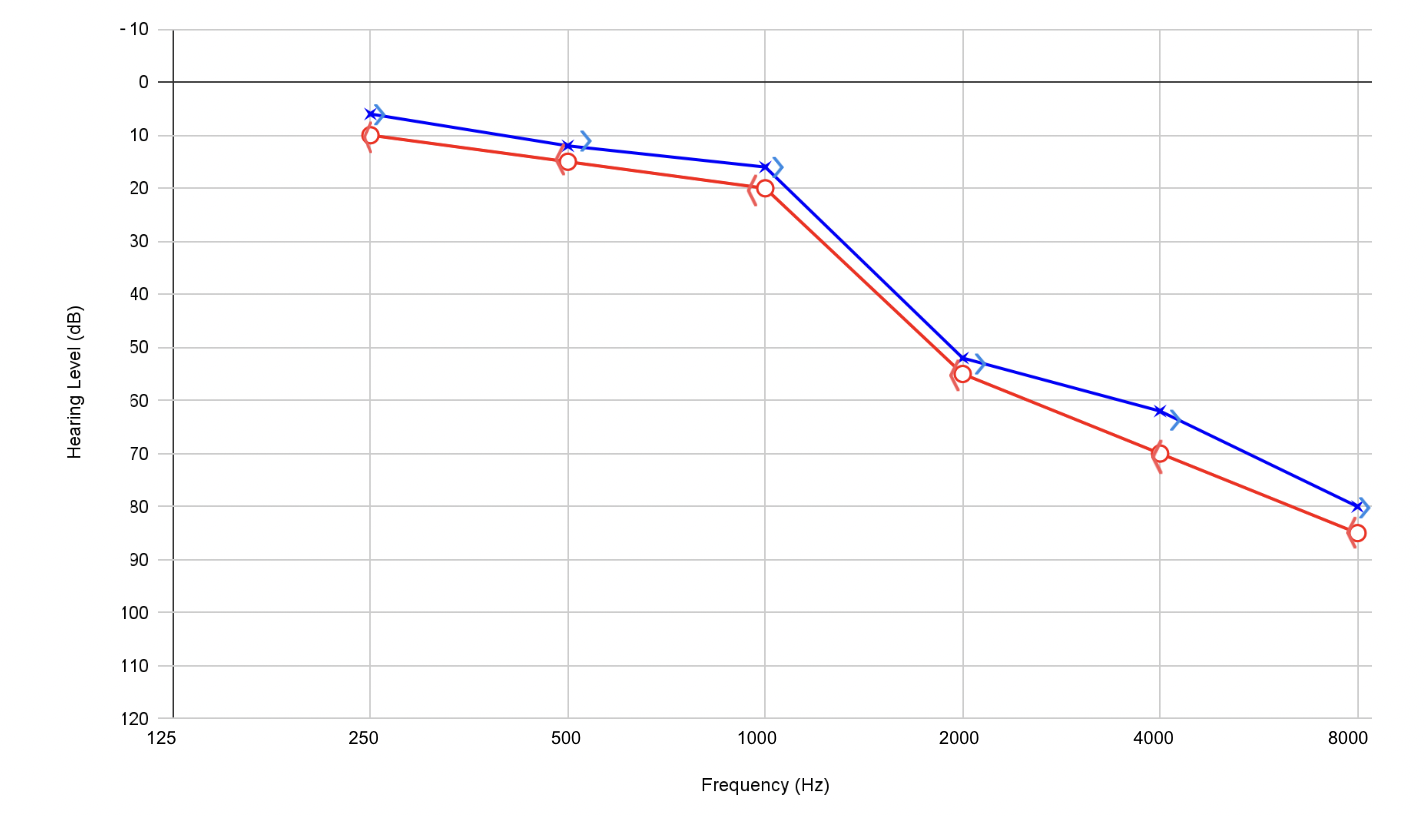
Presbyacusis (age-related hearing loss)
The pathophysiology of age-related hearing loss (ARHL), or presbycusis, involves a complex interplay between environmental and genetic factors.6 These include noise exposure, genetic predisposition, cell damage and neural degeneration.
Presbycusis is characterised by bilateral hearing loss above 2000Hz. On a standard audiogram, presbycusis appears as an overall down-sloping line representing impaired hearing at higher frequency sounds.5
Presbyacusis is classically bilateral and symmetrical.
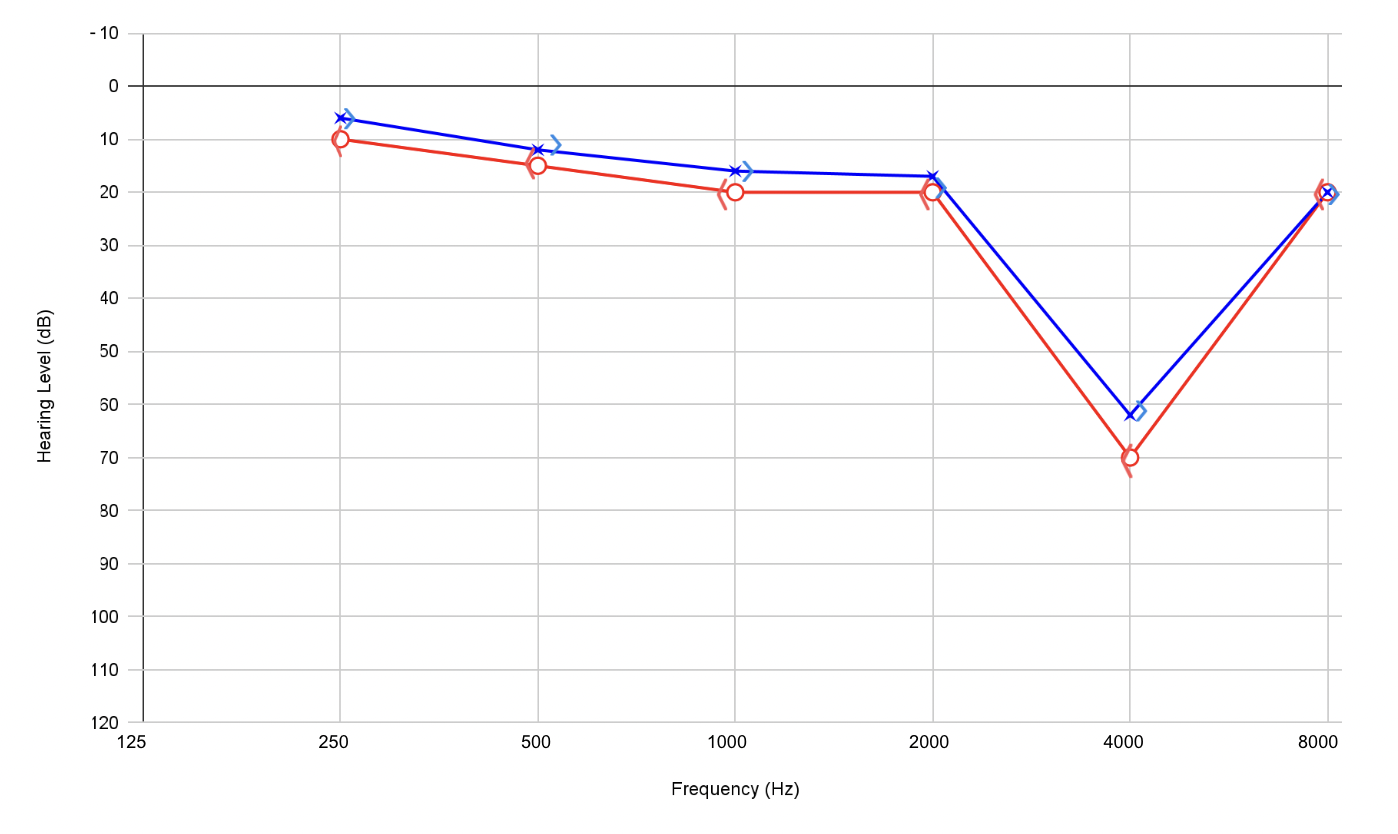
Noise-induced hearing loss (sensorineural hearing loss with a notch at 4000 Hz)
Noise-induced hearing loss is typically characterised by a notch on the audiogram at 4000 Hz.
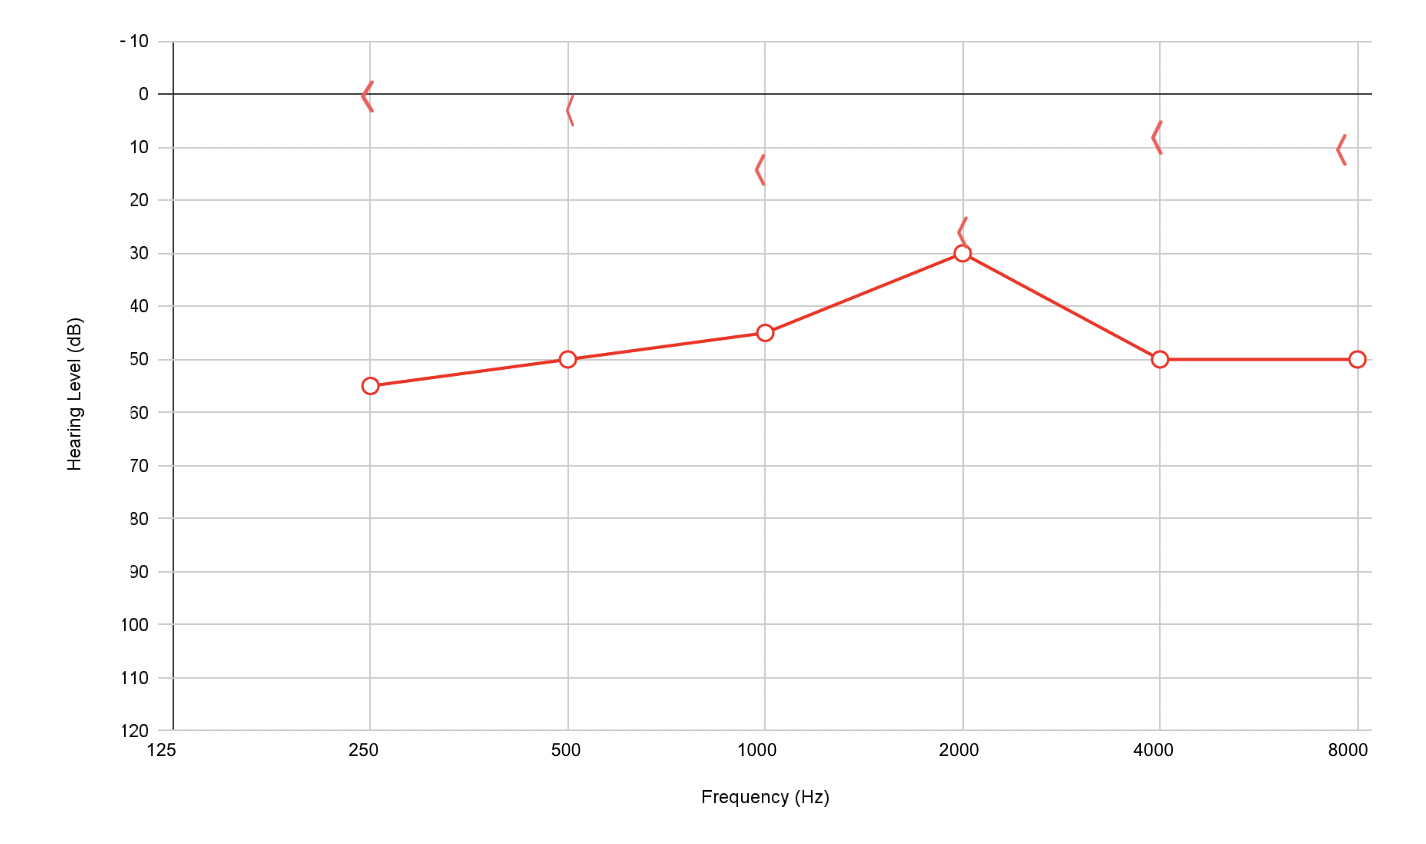
Meniere’s disease (right ear)
Meniere’s disease is typically characterised by low-frequency sensorineural hearing loss.

Meniere’s disease
Meniere’s disease presents a triad of vertigo, tinnitus and hearing loss.
Otosclerosis (right ear)
Otosclerosis is pathologically characterised by abnormal bony remodelling, which includes bone resorption, new bone deposition, and vascular proliferation in the temporal bone. 7
Otosclerosis is characterised by conductive hearing loss with loss in bone conduction at 2000 Hz (referred to as Carhart’s notch).
Reviewer
Mr Rohan Vithlani
Senior Clinical Fellow in Otology
St. Georges University Hospital Trust
Editor
Dr Chris Jefferies
References
- Rose, E. (2011). Australian Family Physician, 40(5), 290-292. Pubmed.
- Audiology6. Audiogram. License: [Public domain]
- Clare J Perkins, Scott Mitchell. Audiology Clinical Masking. StatPearls.22/03/22. Available from: [LINK]
- Scarpa A, Ralli M, Cassandro C, Gioacchini FM, Greco A, Di Stadio A, Cavaliere M, Troisi D, de Vincentiis M, Cassandro E. Inner-Ear Disorders Presenting with Air-Bone Gaps: A Review. J Int Adv Otol. 2020 Apr. Available from: [LINK]
- Cheslock M, De Jesus O. Presbycusis. StatPearls Publishing. 2022. Available from: [LINK]
- Tawfik KO, Klepper K, Saliba J, Friedman RA. Advances in understanding of presbycusis. J Neurosci Res. 2020 Sep;98(9):1685-1697.
- Quesnel AM, Ishai R, McKenna MJ. Otosclerosis: Temporal Bone Pathology. Otolaryngol Clin North Am. 2018 Apr;51(2):291-303.
