

- 📖 Geeky Medics OSCE Book
- ⚡ Geeky Medics Bundles
- ✨ 1300+ OSCE Stations
- ✅ OSCE Checklist PDF Booklet
- 🧠 UKMLA AKT Question Bank
- 💊 PSA Question Bank
- 💉 Clinical Skills App
- 🗂️ Flashcard Collections | OSCE, Medicine, Surgery, Anatomy
- 💬 SCA Cases for MRCGP
To be the first to know about our latest videos subscribe to our YouTube channel 🙌
Test your ECG interpretation skills with the following ECG case studies with answers.
For each case, we encourage you to interpret the ECG systematically, commenting on the rate, rhythm, axis, P waves, PR interval, QRS complex, ST segment and T waves. For more information, see our guide on how to read an ECG.
For each ECG case study, consider the most likely diagnosis and formulate a management plan.
Case study 1
A 62 year old man with a background of hypertension and angina presents with sudden onset central chest pain radiating to his jaw.
Review this ECG using a systematic approach.
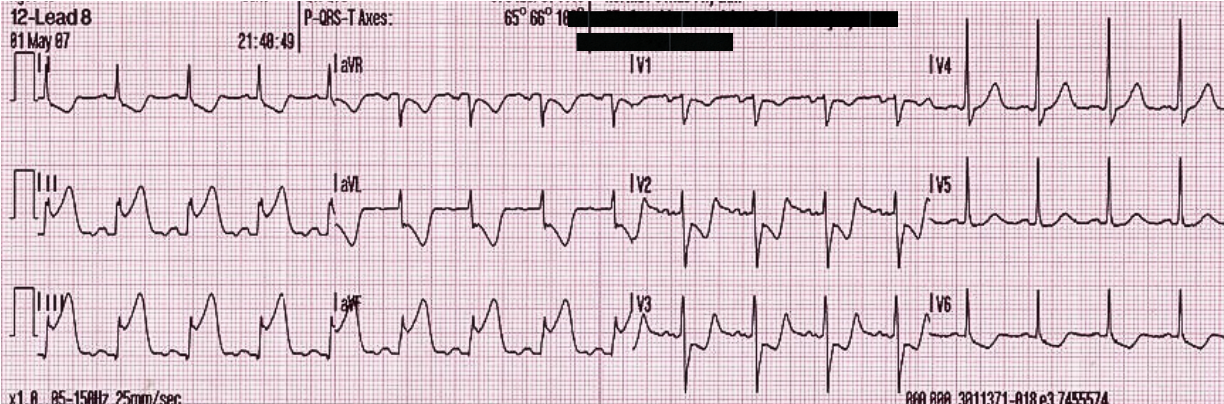
ECG interpretation
| Systematic interpretation | Findings |
| Rate | 100 |
| Rhythm | sinus rhythm |
| Axis | normal |
| P waves | present and followed by QRS |
| PR interval | normal |
| QRS complex | narrow |
| ST segment | ST elevation in leads II, III, aVF with ST depression in V2, V3, V6, I and aVL |
| T waves | ST changes as described |
| Diagnosis | Inferior STEMI |
Clinical discussion
The immediate abnormality noted in this ECG is ST elevation in the inferior leads (II, III and aVF) with ST depression in the anteroseptal and lateral leads.
Management of a STEMI
This patient is having an ST-elevation myocardial infarction (STEMI).
The management priority for this patient is to organise primary percutaneous coronary intervention (PPCI) so that the occluded coronary artery can be opened up. Remember that ‘time is muscle‘, and this patient needs to be discussed with the local cardiac catheterisation laboratory immediately.
Thrombolysis is a second line treatment and should be considered only when PPCI is unavailable within 120 minutes.
The MONA mnemonic is used to remember other treatment priorities alongside organising reperfusion therapy:
- Morphine
- Oxygen (if sats <94%)
- Nitrates
- Aspirin (300mg loading dose)
Case study 2
A 70 year old woman with lung cancer is admitted to hospital with gradually worsening breathlessness and chest pain.
Review this ECG using a systematic approach.
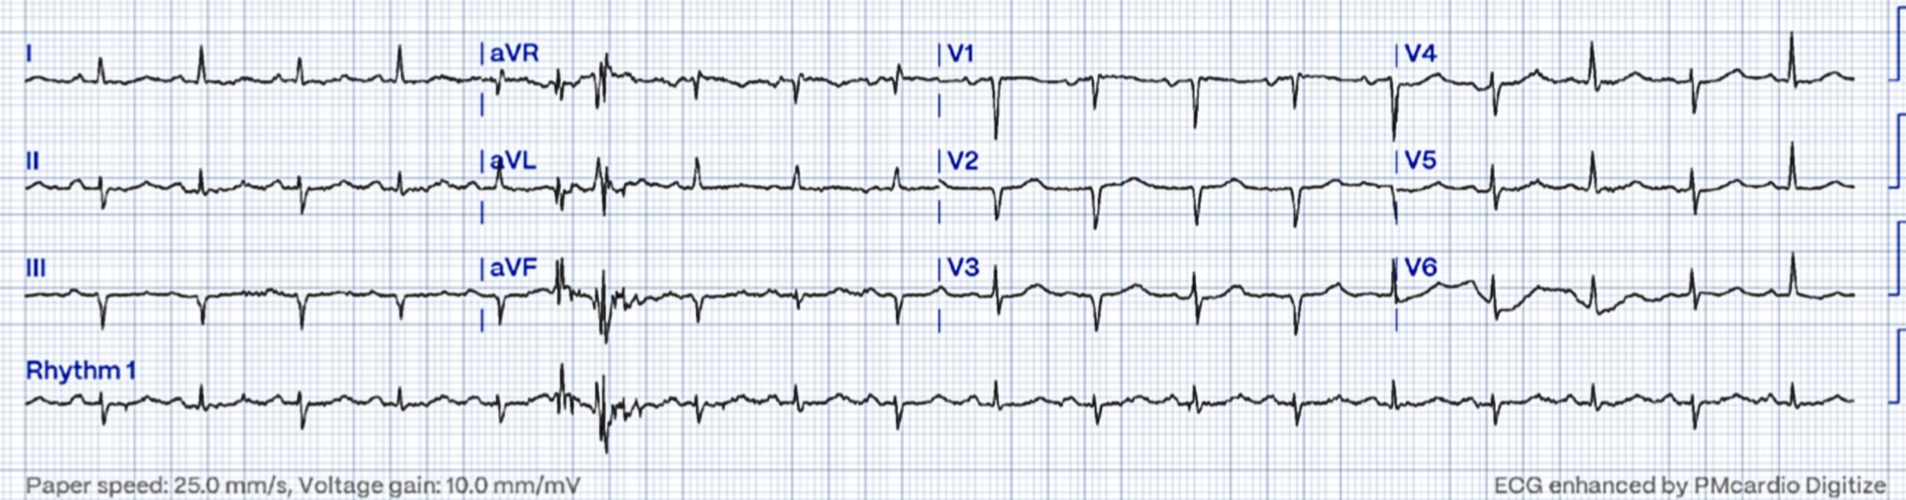
ECG interpretation
| Systematic interpretation | Findings |
| Rate | 108 |
| Rhythm | sinus rhythm |
| Axis | alternating left axis and normal axis |
| P waves | present and followed by QRS |
| PR interval | normal |
| QRS complex | narrow complexes, alternating low voltage QRS morphology in chest leads (<10mm) and most limb leads (<5mm) |
| ST segment | normal |
| T waves | normal |
| Diagnosis | electrical alternans due to large pericardial effusion |
Clinical discussion
This ECG demonstrates beat-to-beat variation in QRS amplitude and axis known as electrical alternans.
Electrical alternans
Electrical alternans is characterised by beat-to-beat change in QRS axis or amplitude as seen here. It is classically seen in patients with a large volume pericardial effusion.
The variation in cardiac axis and QRS amplitude is due to the change in orientation of the heart and the attenuation of the electrical impulses as the heart swings from beat to beat in the pericardial sac.
Small QRS complexes can also be seen in obese patients, where the signals have to travel through larger amounts of adipose tissue, and in COPD, where the signals have to travel further in barrel-chested patients.

In the absence of a pericardial effusion, electrical alternans can be caused by other conditions such as a pneumothorax resulting in alterations of cardiac motion and SVTs especially atrioventricular re-entrant tachycardia (AVRT) where it is thought to be related to different conduction properties of the accessory pathways.
Case study 3
An 85 year old man presents following a collapse at home.
Review this ECG using a systematic approach.
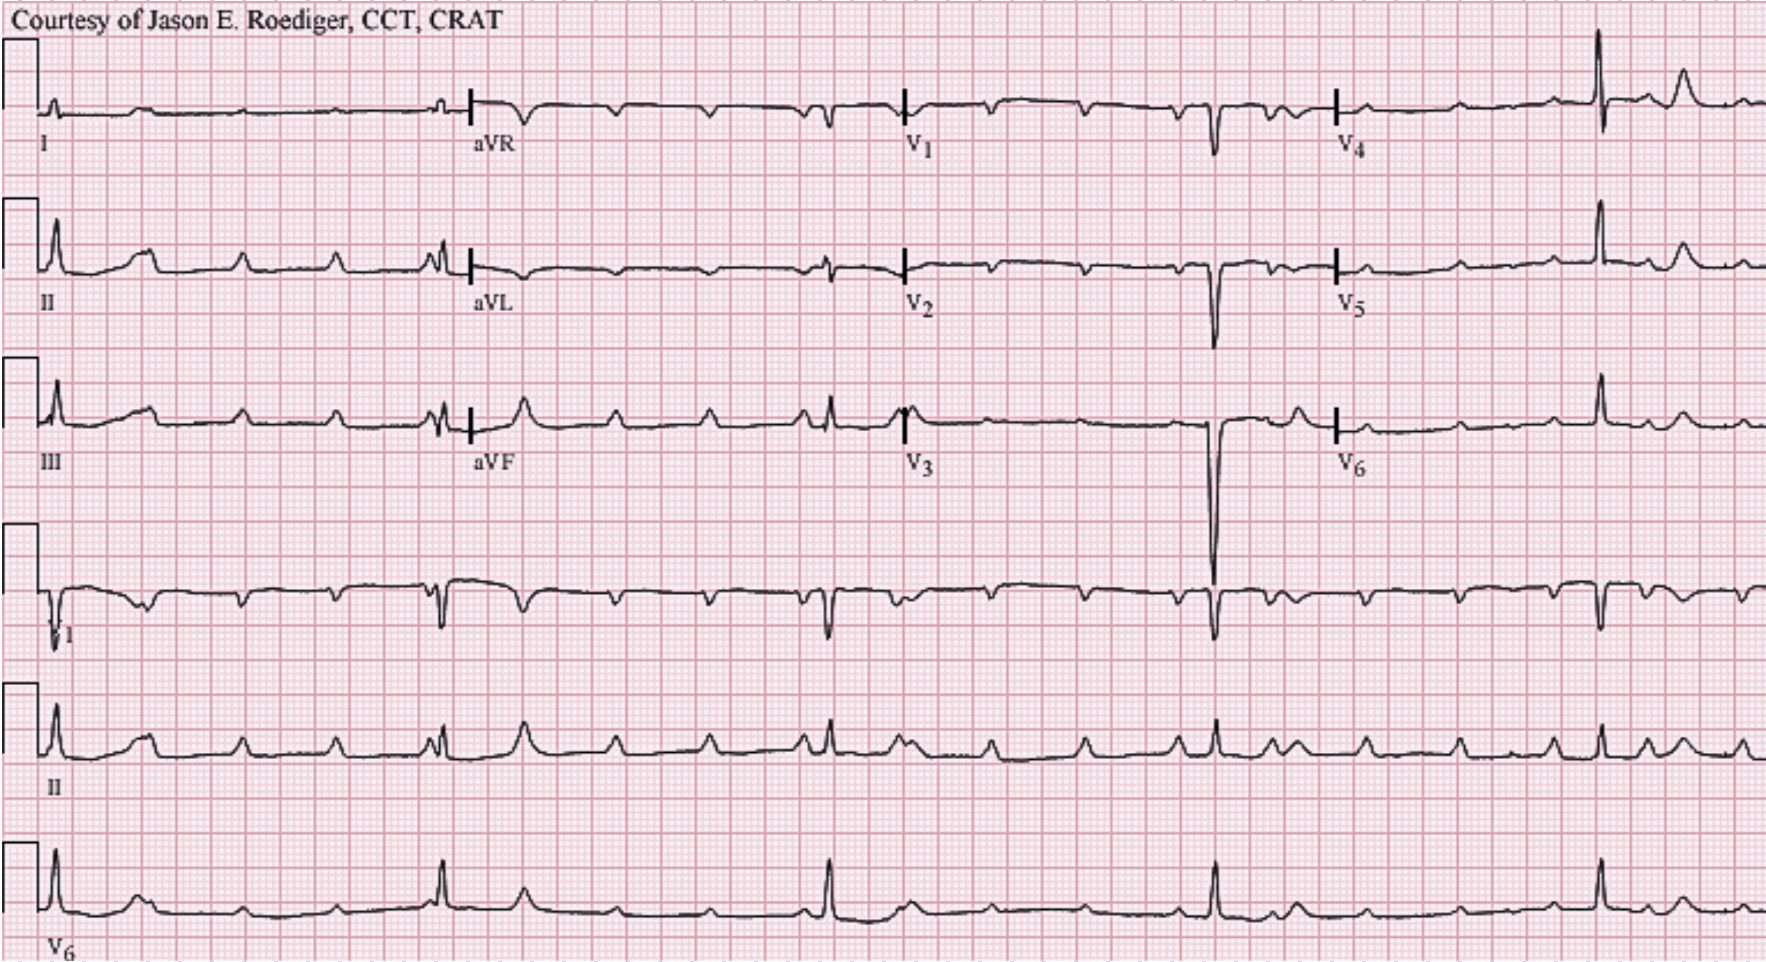
ECG interpretation
| Systematic interpretation | Findings |
| Rate | ventricular rate 27 |
| Rhythm | regular P-P interval and regular R-R interval |
| Axis | normal |
| P waves | present, no relationship to QRS complexes, inverted p waves in V1, V2, aVR and aVL |
| PR interval | not applicable – complete dissociation between P wave and QRS complex |
| QRS complex | narrow |
| ST segment | normal |
| T waves | T wave inversion in V1 (normal) |
| Diagnosis | Complete heart block |
Clinical discussion
This ECG demonstrates complete dissociation between atrial and ventricular activity. The atrial rate is 120bpm and the ventriclar rate is 27bpm. Complete atrioventricular dissociation is known as third degree heart block or complete heart block. The QRS complexes are narrow suggesting a junctional escape rhythm.
The P wave inversion seen here suggests the atrial activity is coming from an ectopic focus.
Complete heart block
During a normal heartbeat, electrical activity is initiated in the sinoatrial node, travels to the AV node (where it pauses, allowing the atria to fully contract), and then passes down the His-Purkinje system to initiate a ventricular contraction. For more information, see the Geeky Medics guide to the conduction system of the heart.
Pathological conduction at the AV node results in varying degrees of heart block: 1st degree heart block, second degree heart block (mobitz type 1 and mobitz type 2) and third degree block (complete heart block). Mobitz type 2 is more likely to progress to complete heart block compared to mobitz type 1. First degree heart block is considered a benign finding.
In third degree heart block there is complete dissociation between atrial and ventricular activity. The atria will continue to beat at a regular rate but these impulses will not be transmitted to the AV node.
Third degree heart block is associated with either a junctional escape rhythm (initiated at the AV junction resulting in narrow QRS complexes) or a ventricular escape rhythm (initiated in the ventricles resulting in a broad QRS complex).
Causes of third degree heart block include:
- Inferior MI
- AV node blocking drugs (beta blockers, calcium channel blockers, digoxin)
- Idiopathic degeneration of the conducting system
Treatment
Third degree AV block can result in profound haemodynamic instability and ventricular standstill. Patients with symptomatic bradycardia should be managed as per the ALS bradycardia algorithm.
Atropine is often ineffective due to the AV node dysfunction but is more likely to be successful with narrow complex escape rhythms. As a holding measure pending a permanent pacemaker insertion, an isoprenaline infusion or temporary pacing (transcutaneous pacing or temporary pacing wire) may be required.
Case study 4
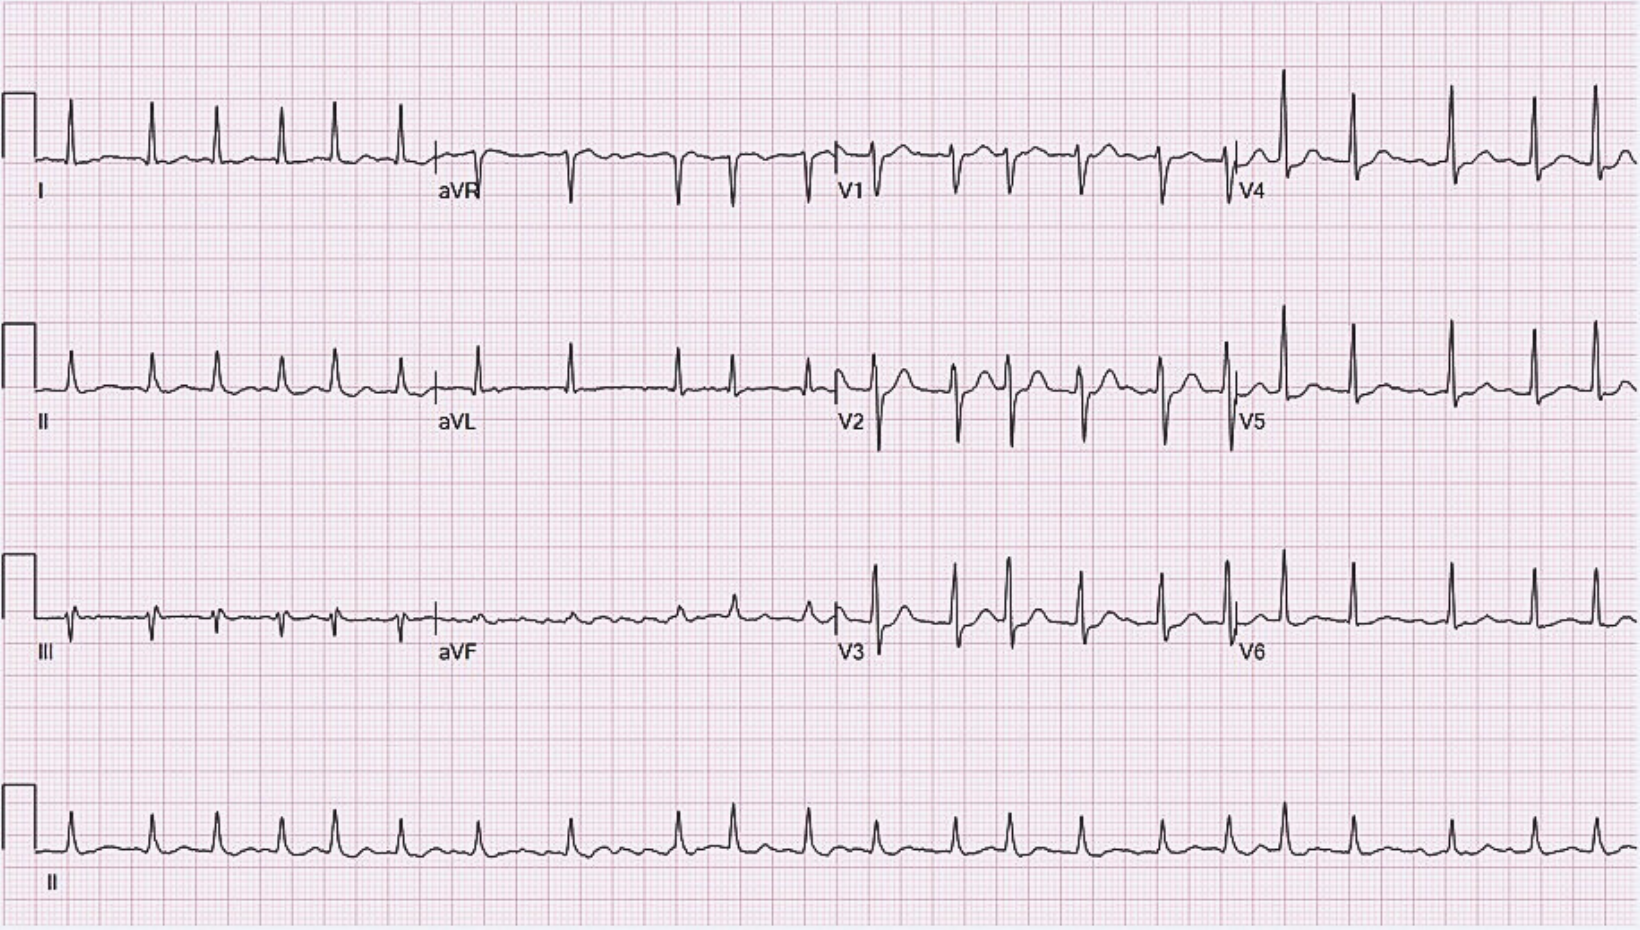
A 45 year old man is found to be hypertensive. A routine ECG is requested.
Review this ECG using a systematic approach.
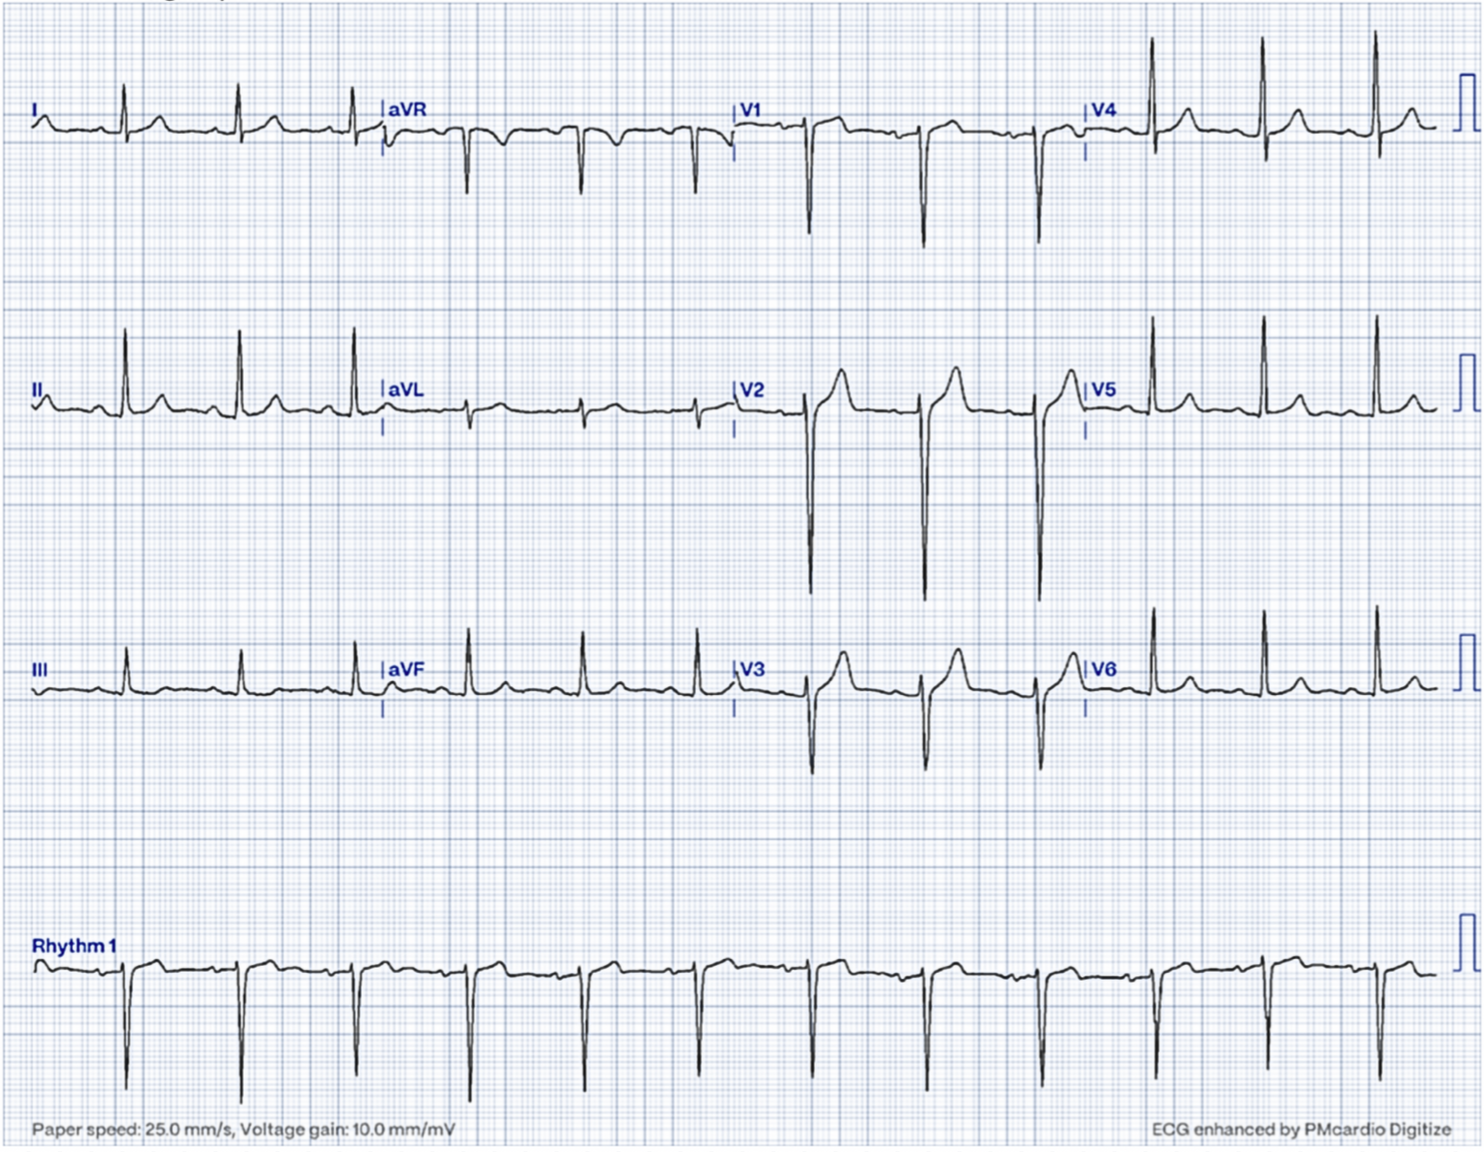
| Systematic interpretation | Findings |
| Rate | 60 |
| Rhythm | sinus rhythm |
| Axis | normal |
| P waves | present, followed by QRS |
| PR interval | normal |
| QRS complex | narrow complexes with large amplitudes |
| ST segment | normal |
| T waves | normal |
| Diagnosis | left ventricular hypertrophy |
Clinical discussion
This ECG shows left ventricular hypertrophy, most commonly diagnosed on ECG using the Sokolow-Lyon criteria.
Sokolow-Lyon criteria for LVH
The criteria are met if the depth of the S wave in V1 or V2 (whichever is biggest) added to the height of the R wave in V5 or V6 (whichever is biggest) is greater than 35mV.
Each small square is 1mV. Therefore, 35mV is equal to 35 small squares or 7 large squares.
The outline of the large squares can be difficult to appreciate in this ECG. However, on close inspection, the S wave in V2 is 32mV (or just over 6 large squares) from baseline, and the R wave is largest in V5 where it is 18mV or just over 3 large squares.
The combined measurement is 50mV, which is above the threshold for LVH.
In hypertension, the heart pumps harder against resistance and like any muscle, it hypertrophies over time. In a hypertrophied heart there is more muscle; more muscle generates more electricity and more electricity is transmitted to the ECG resulting in larger QRS complexes.
Case study 5
A 52 year old woman presents with intermittent palpitations and lightheadedness over the past 2 weeks. She has a background of hypertension and type 2 diabetes.
Review this ECG using a systematic approach.
| Systematic interpretation | Findings |
| Rate | 132 |
| Rhythm | irregularly irregular |
| Axis | normal |
| P waves | absent |
| PR interval | not applicable |
| QRS complex | narrow |
| ST segment | ST depression in V3-V5 |
| T waves | normal |
| Diagnosis | Atrial fibrillation (AF) with a rapid ventricular response |
Clinical discussion
This ECG shows an irregularly irregular rhythm with absent P waves and a ventricular rate of 132 bpm consistent with atrial fibrillation with a fast ventricular response (‘fast AF’). There is ST depression in V3 – V5 likely secondary to rate-related ischaemia.
The three key considerations when managing atrial fibrillation are: rate control, rhythm control and anticoagulation.
Rate control would be an appropriate initial management strategy for this patient. She has presented with over 48 hours of symptoms, and therefore, immediate synchronised DC cardioversion would be contraindicated in the absence of adverse features (shock, syncope, heart failure, or myocardial ischaemia). The subtle ST changes in this ECG are insufficient to constitute myocardial ischaemia in this context.
The CHA2DS2Vasc score calculates the risk of stroke in patients with atrial fibrillation, and the ORBIT tool helps evaluate the risk of bleeding. These tools can guide decision-making regarding anticoagulation. For more information, see the Geeky Medics guide to atrial fibrillation.
This patient has several risk factors for thromboembolic complications (female, hypertension and diabetes) and, therefore, should be offered anticoagulation unless significant bleeding risk factors are present.
Looking for more ECG case studies?
The Geeky Medics ECG Case Collection contains over 75 ECG cases, which will help you learn to interpret ECGs using a systematic approach.
Each ECG has a step-by-step interpretation and detailed explanation written by expert clinicians.
References
- Glenlarson. License: [Public domain]
- Jer5150. Pericardial effusion. License: [CC BY-SA]
- Jer5150. Complete heart block. License: [CC BY-SA]
- Ewingdo. Atrial fibrillation. License: [CC BY-SA]
