
- 📖 Geeky Medics OSCE Book
- ⚡ Geeky Medics Bundles
- ✨ 1300+ OSCE Stations
- ✅ OSCE Checklist PDF Booklet
- 🧠 UKMLA AKT Question Bank
- 💊 PSA Question Bank
- 💉 Clinical Skills App
- 🗂️ Flashcard Collections | OSCE, Medicine, Surgery, Anatomy
- 💬 SCA Cases for MRCGP
To be the first to know about our latest videos subscribe to our YouTube channel 🙌
This guide demonstrates how to read an ECG using a systematic approach.
Confirm details
Before beginning ECG interpretation, you should check the following details:
- Confirm the name and date of birth of the patient matches the details on the ECG.
- Check the date and time that the ECG was performed.
- Check the calibration of the ECG (usually 25mm/s and 10mm/1mV).
Heart rate
What is a normal adult heart rate?
- Normal: 60-100 bpm
- Tachycardia: > 100 bpm
- Bradycardia: < 60 bpm
Regular heart rhythm
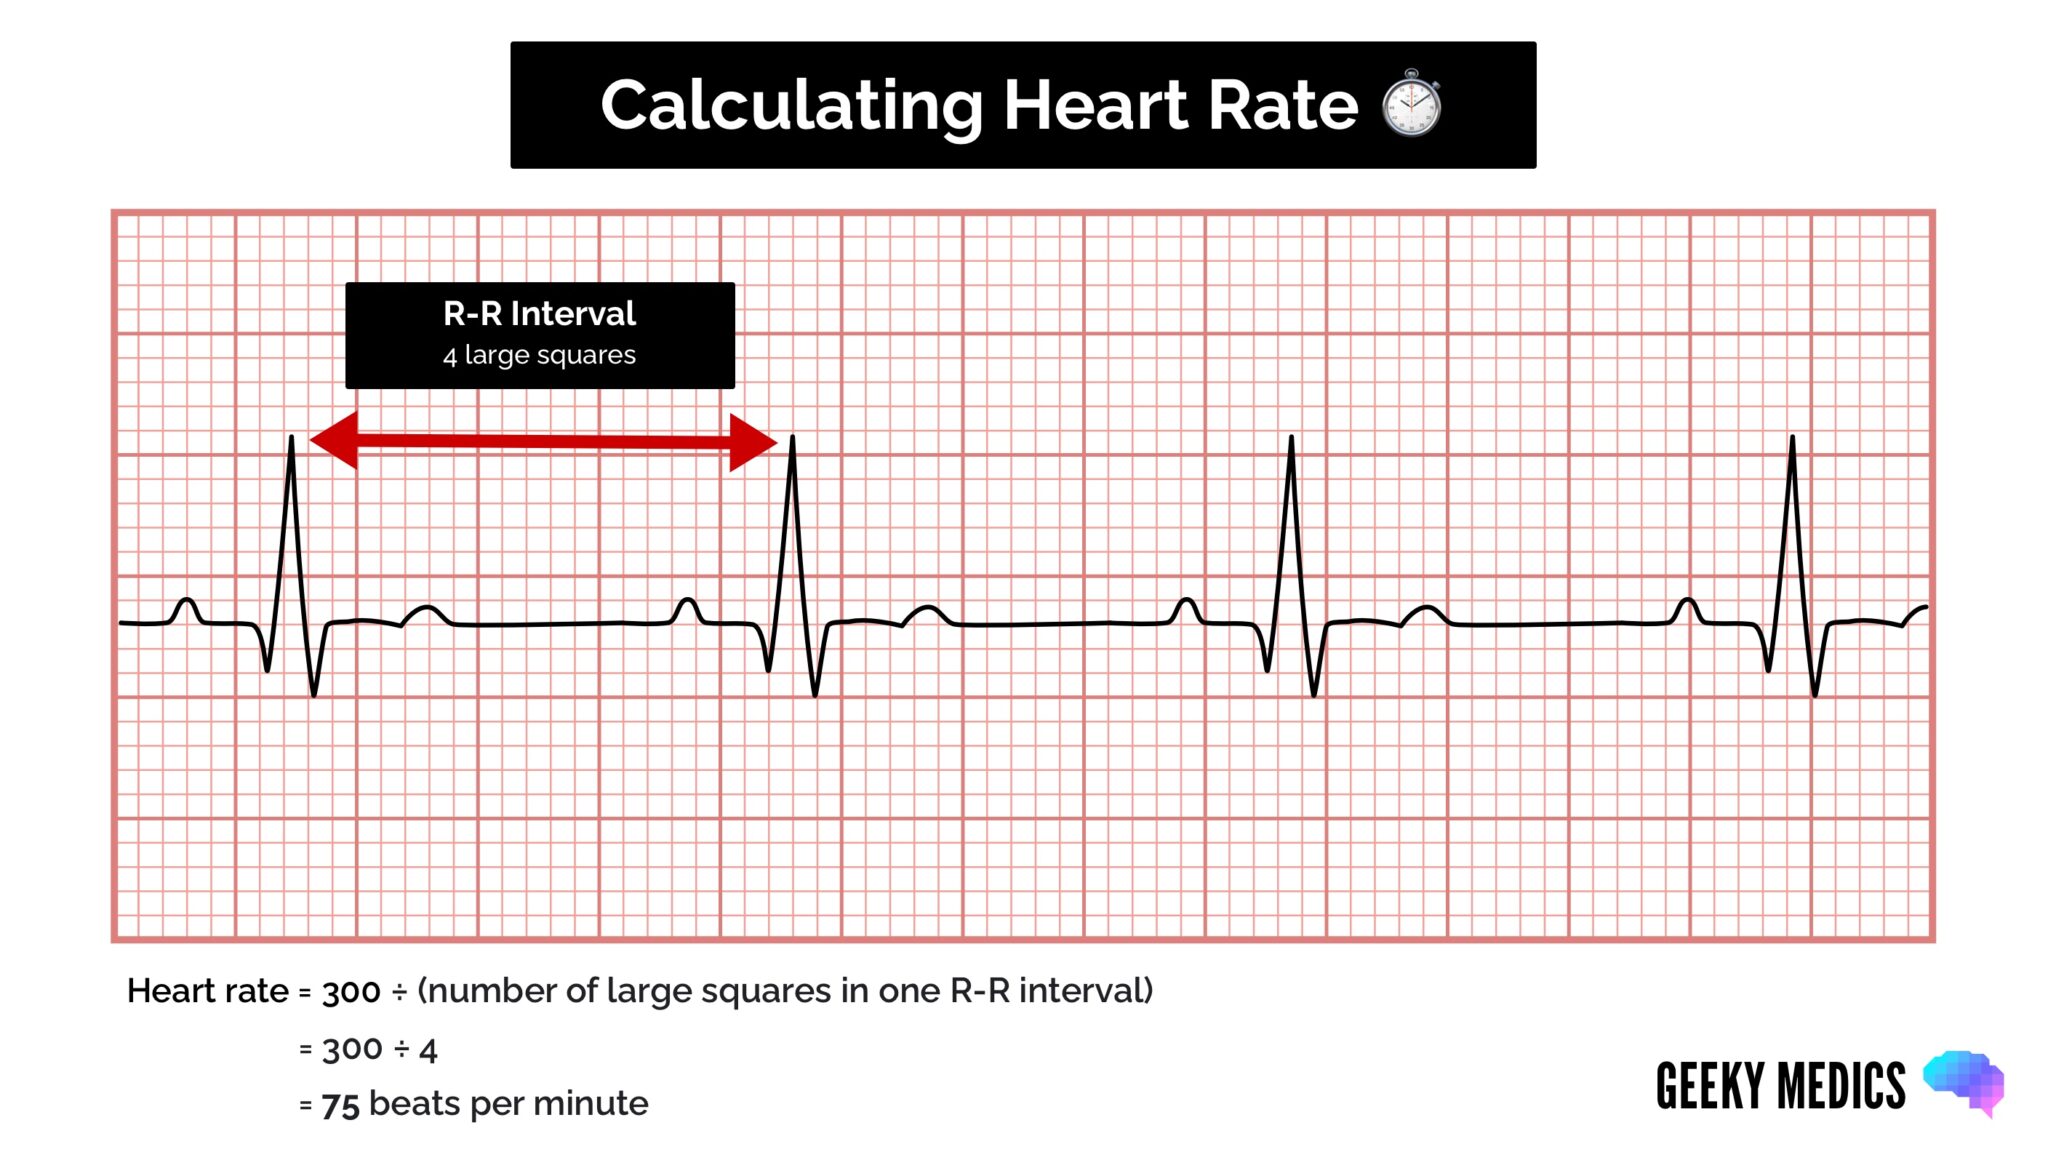
If a patient has a regular heart rhythm, their heart rate can be calculated using the following method:
- Count the number of large squares present within one R-R interval.
- Divide 300 by this number to calculate heart rate.
Heart rate calculation example
- 4 large squares in an R-R interval
- 300/4 = 75 beats per minute
Irregular heart rhythm
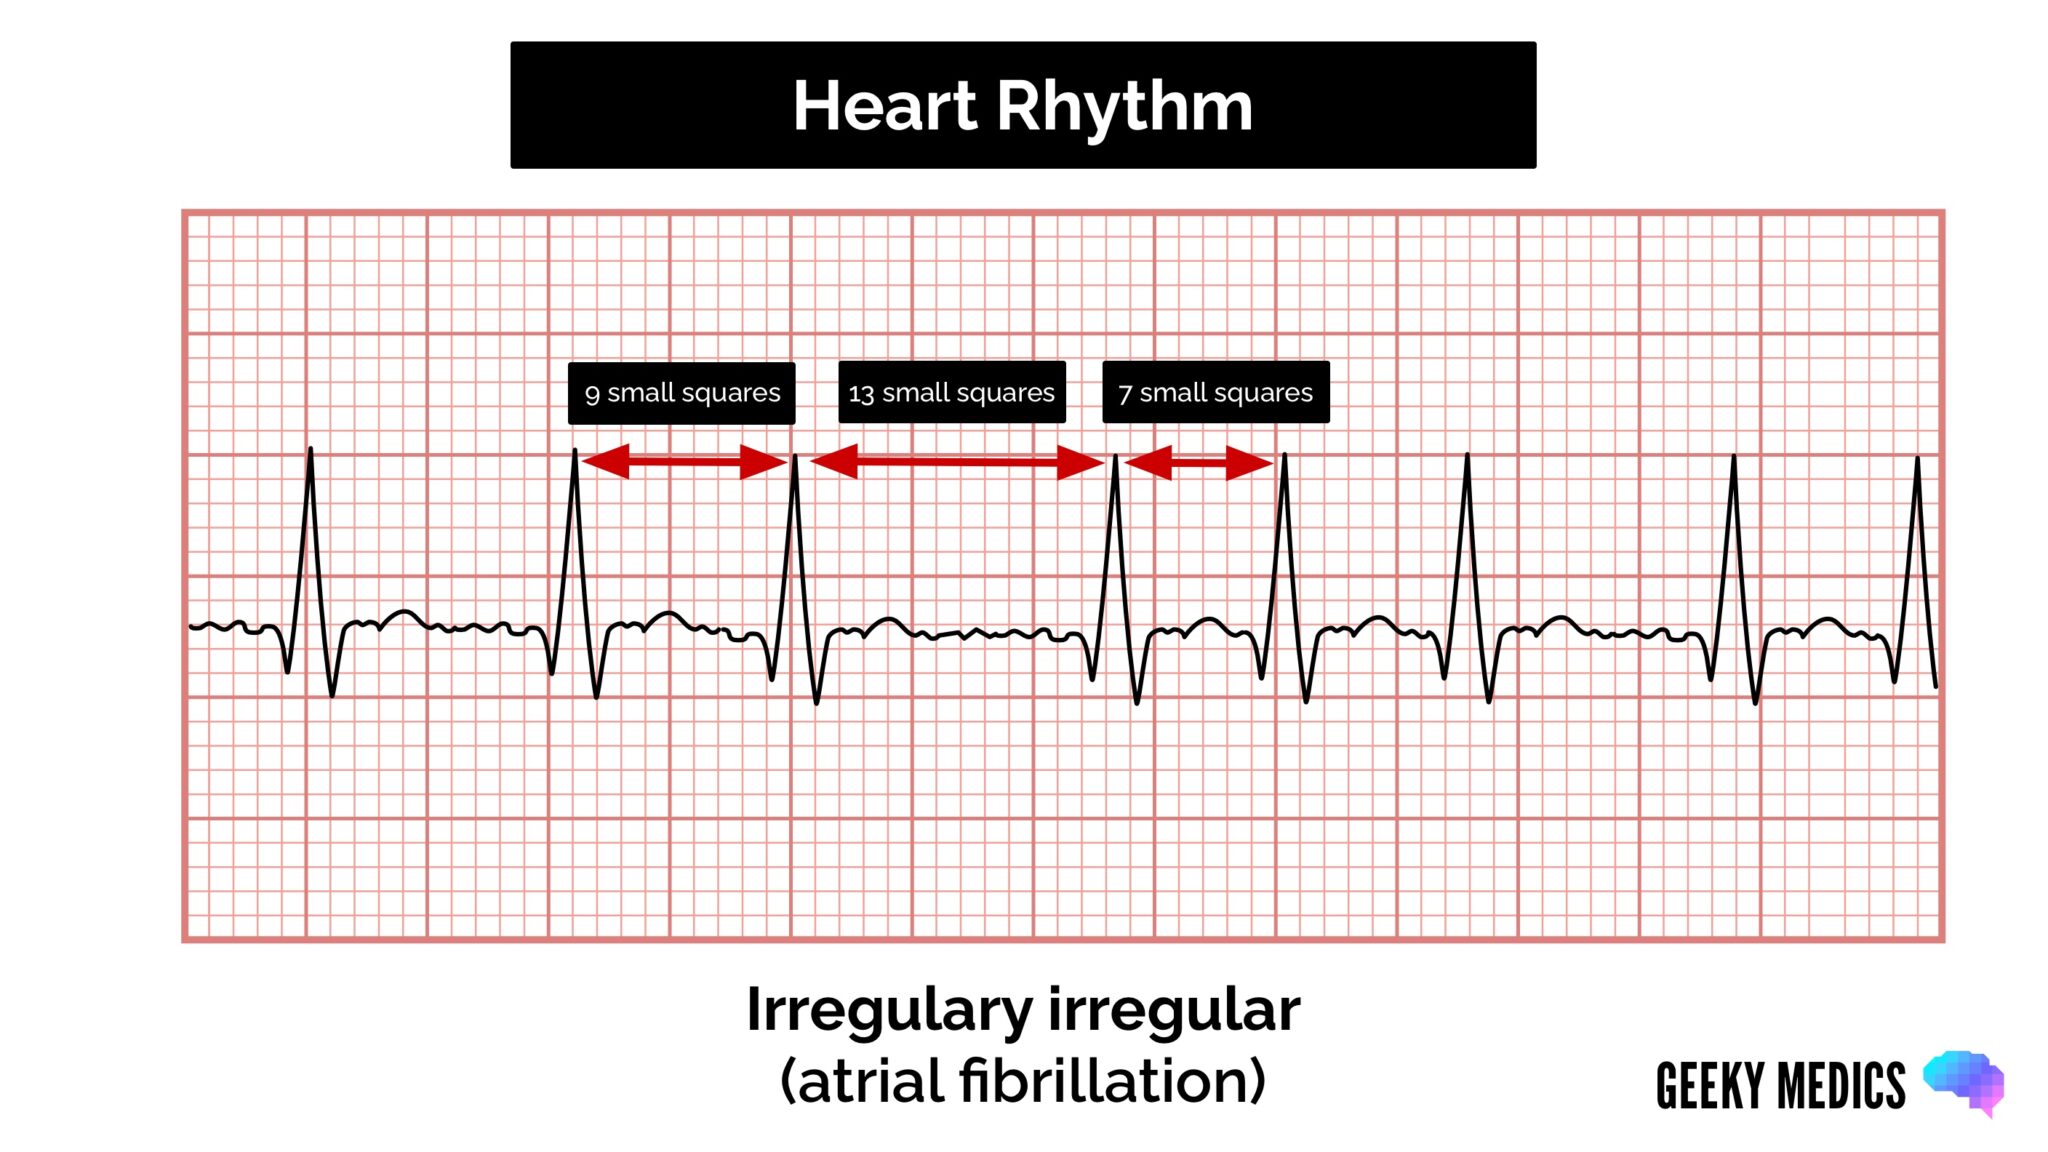
If a patient’s heart rhythm is irregular, the first heart rate calculation method doesn’t work (as the R-R interval differs significantly throughout the ECG). As a result, you need to apply a different method:
- Count the number of complexes on the rhythm strip (each rhythm strip is typically 10 seconds long).
- Multiply the number of complexes by 6 (giving you the average number of complexes in 1 minute).
Heart rate calculation example
- 10 complexes on a rhythm strip
- 10 x 6 = 60 beats per minute
Heart rhythm
A patient’s heart rhythm can be regular or irregular.
Irregular rhythms can be either:
- Regularly irregular (i.e. a recurrent pattern of irregularity)
- Irregularly irregular (i.e. completely disorganised)
Mark out several consecutive R-R intervals on a piece of paper, then move them along the rhythm strip to check if the subsequent intervals are similar.
Hint
If you are suspicious of atrioventricular block (AV block), map out the atrial rate and the ventricular rhythm separately (i.e. mark the P waves and R waves). As you move along the rhythm strip, you can see if the PR interval changes, if QRS complexes are missing or if there is complete dissociation between the two.
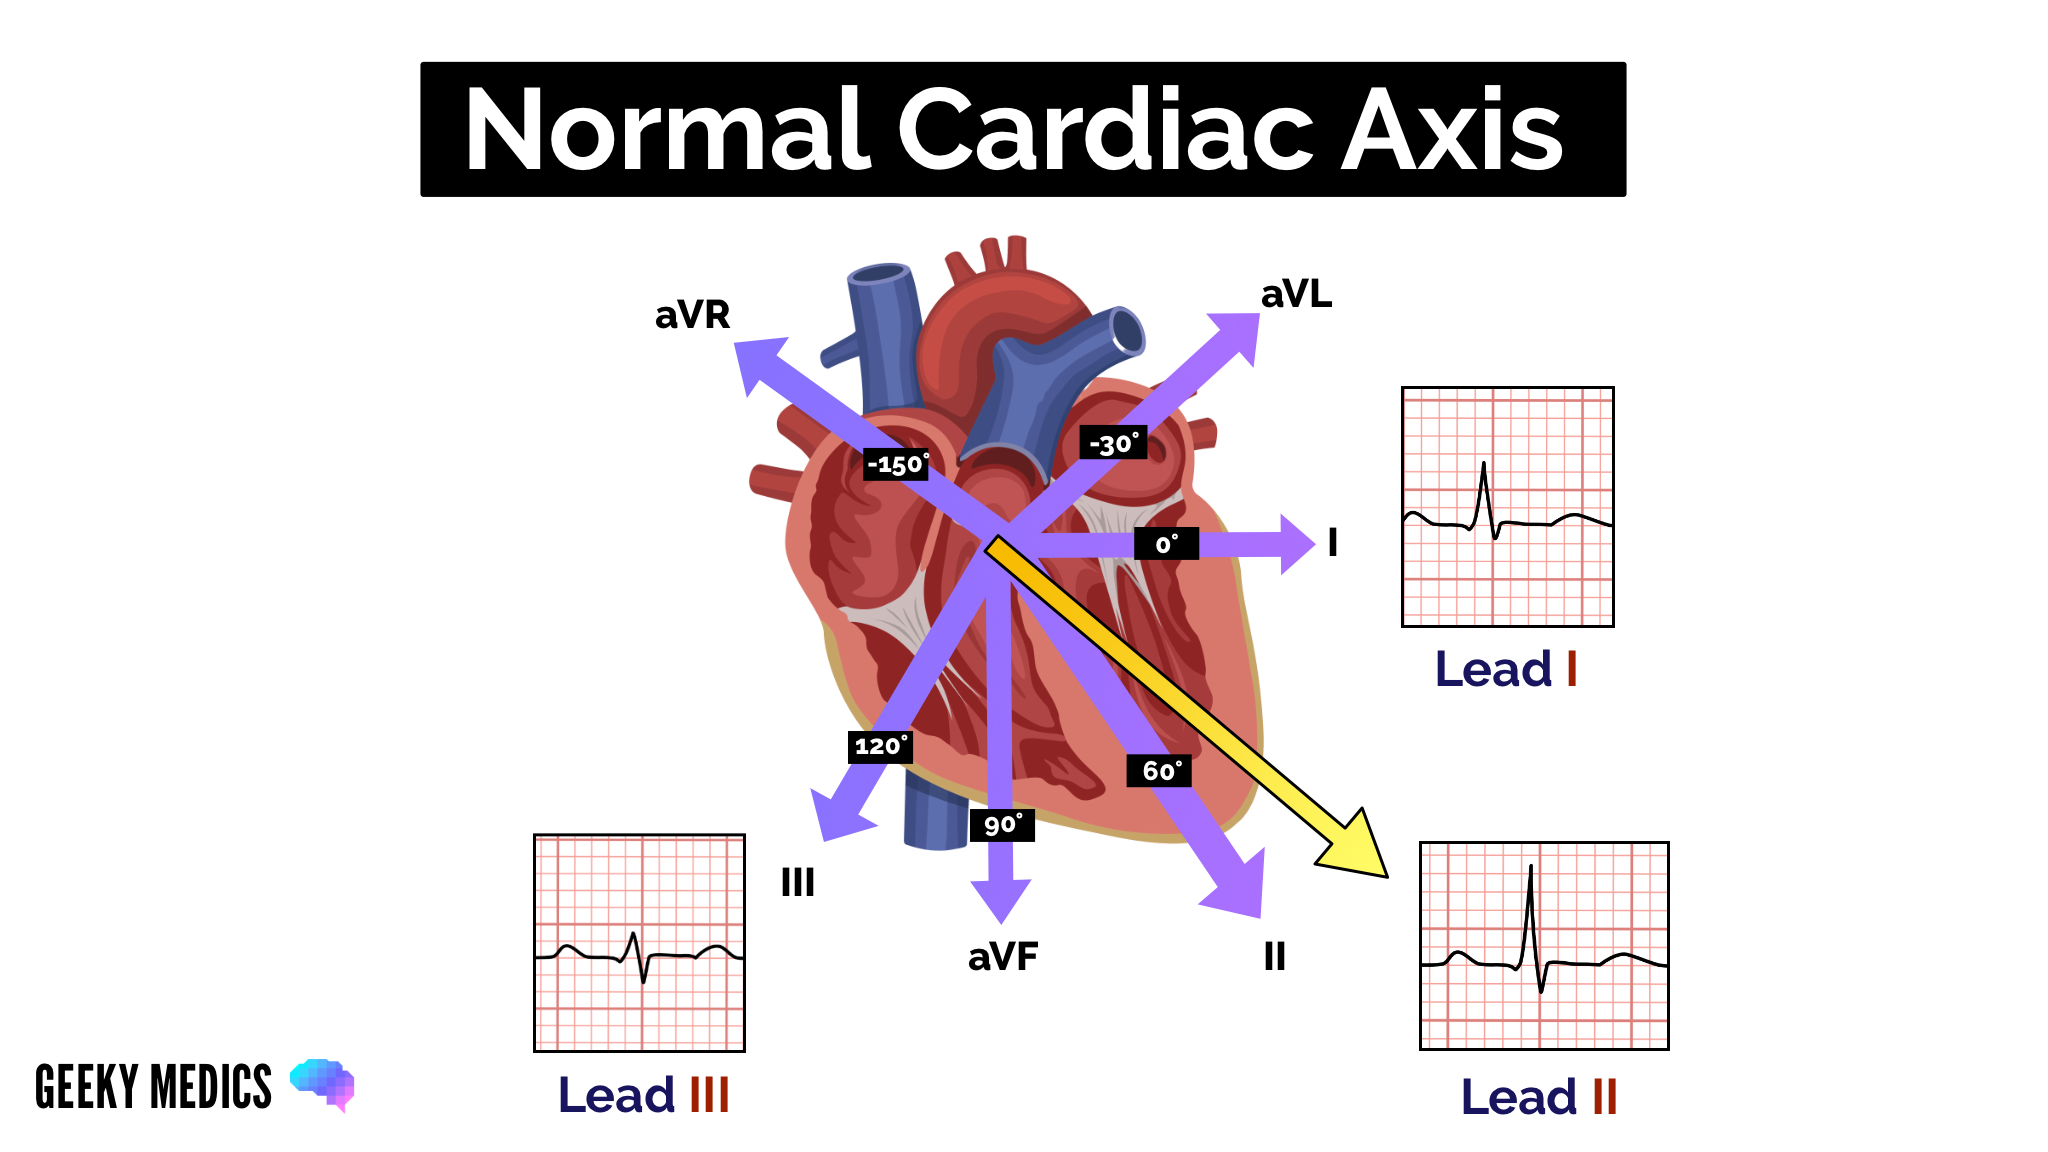
Cardiac axis
Cardiac axis describes the overall direction of electrical spread within the heart.
In a healthy individual, the axis should spread from 11 o’clock to 5 o’clock.
To determine the cardiac axis, you must look at leads I, II and III.
Read our cardiac axis guide to learn more.
Normal cardiac axis
Typical ECG findings for normal cardiac axis:
- Lead II has the most positive deflection compared to leads I and III.
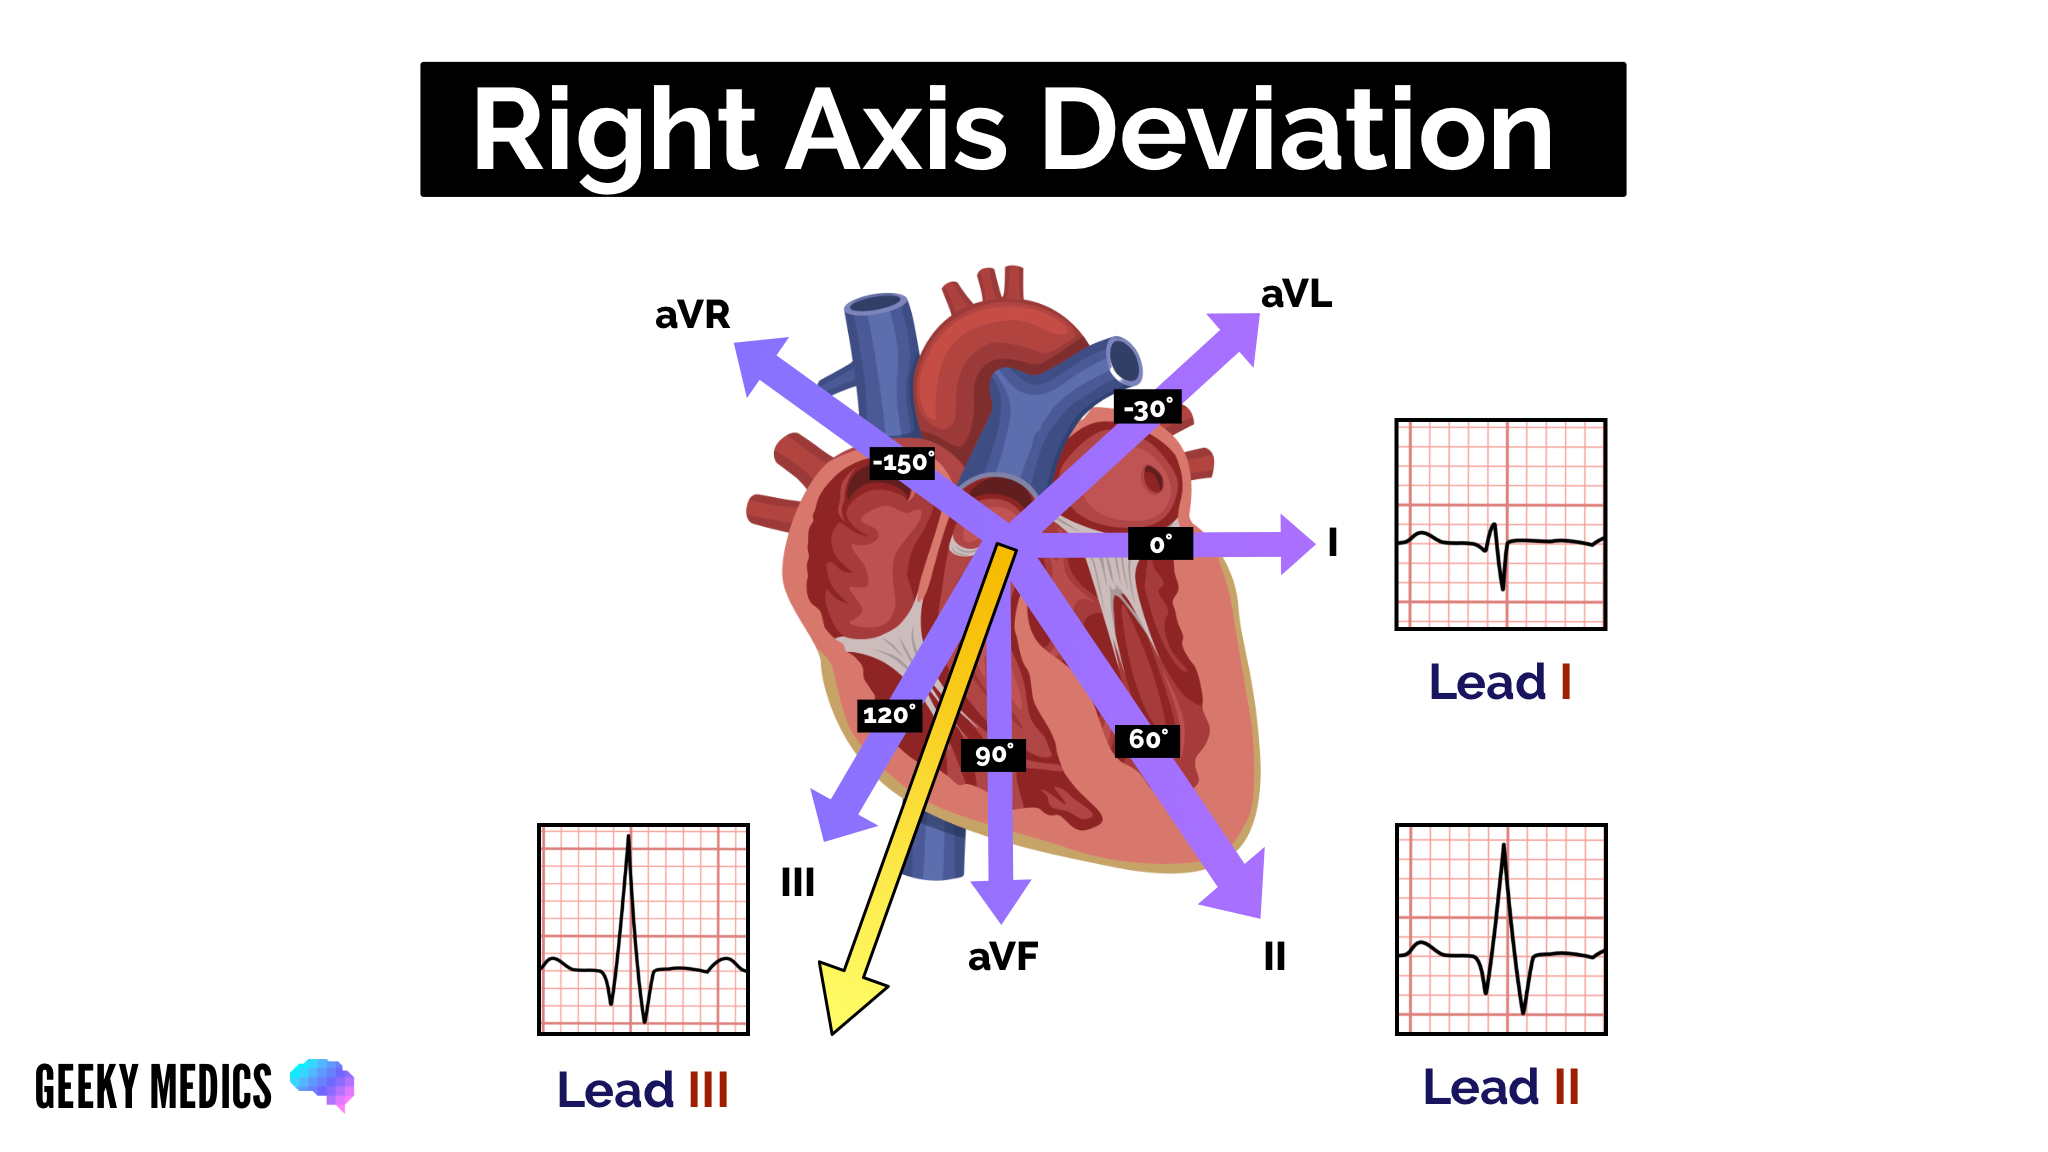
Right axis deviation
Typical ECG findings for right axis deviation:
- Lead III has the most positive deflection, and lead I should be negative.
- Right axis deviation is associated with right ventricular hypertrophy.
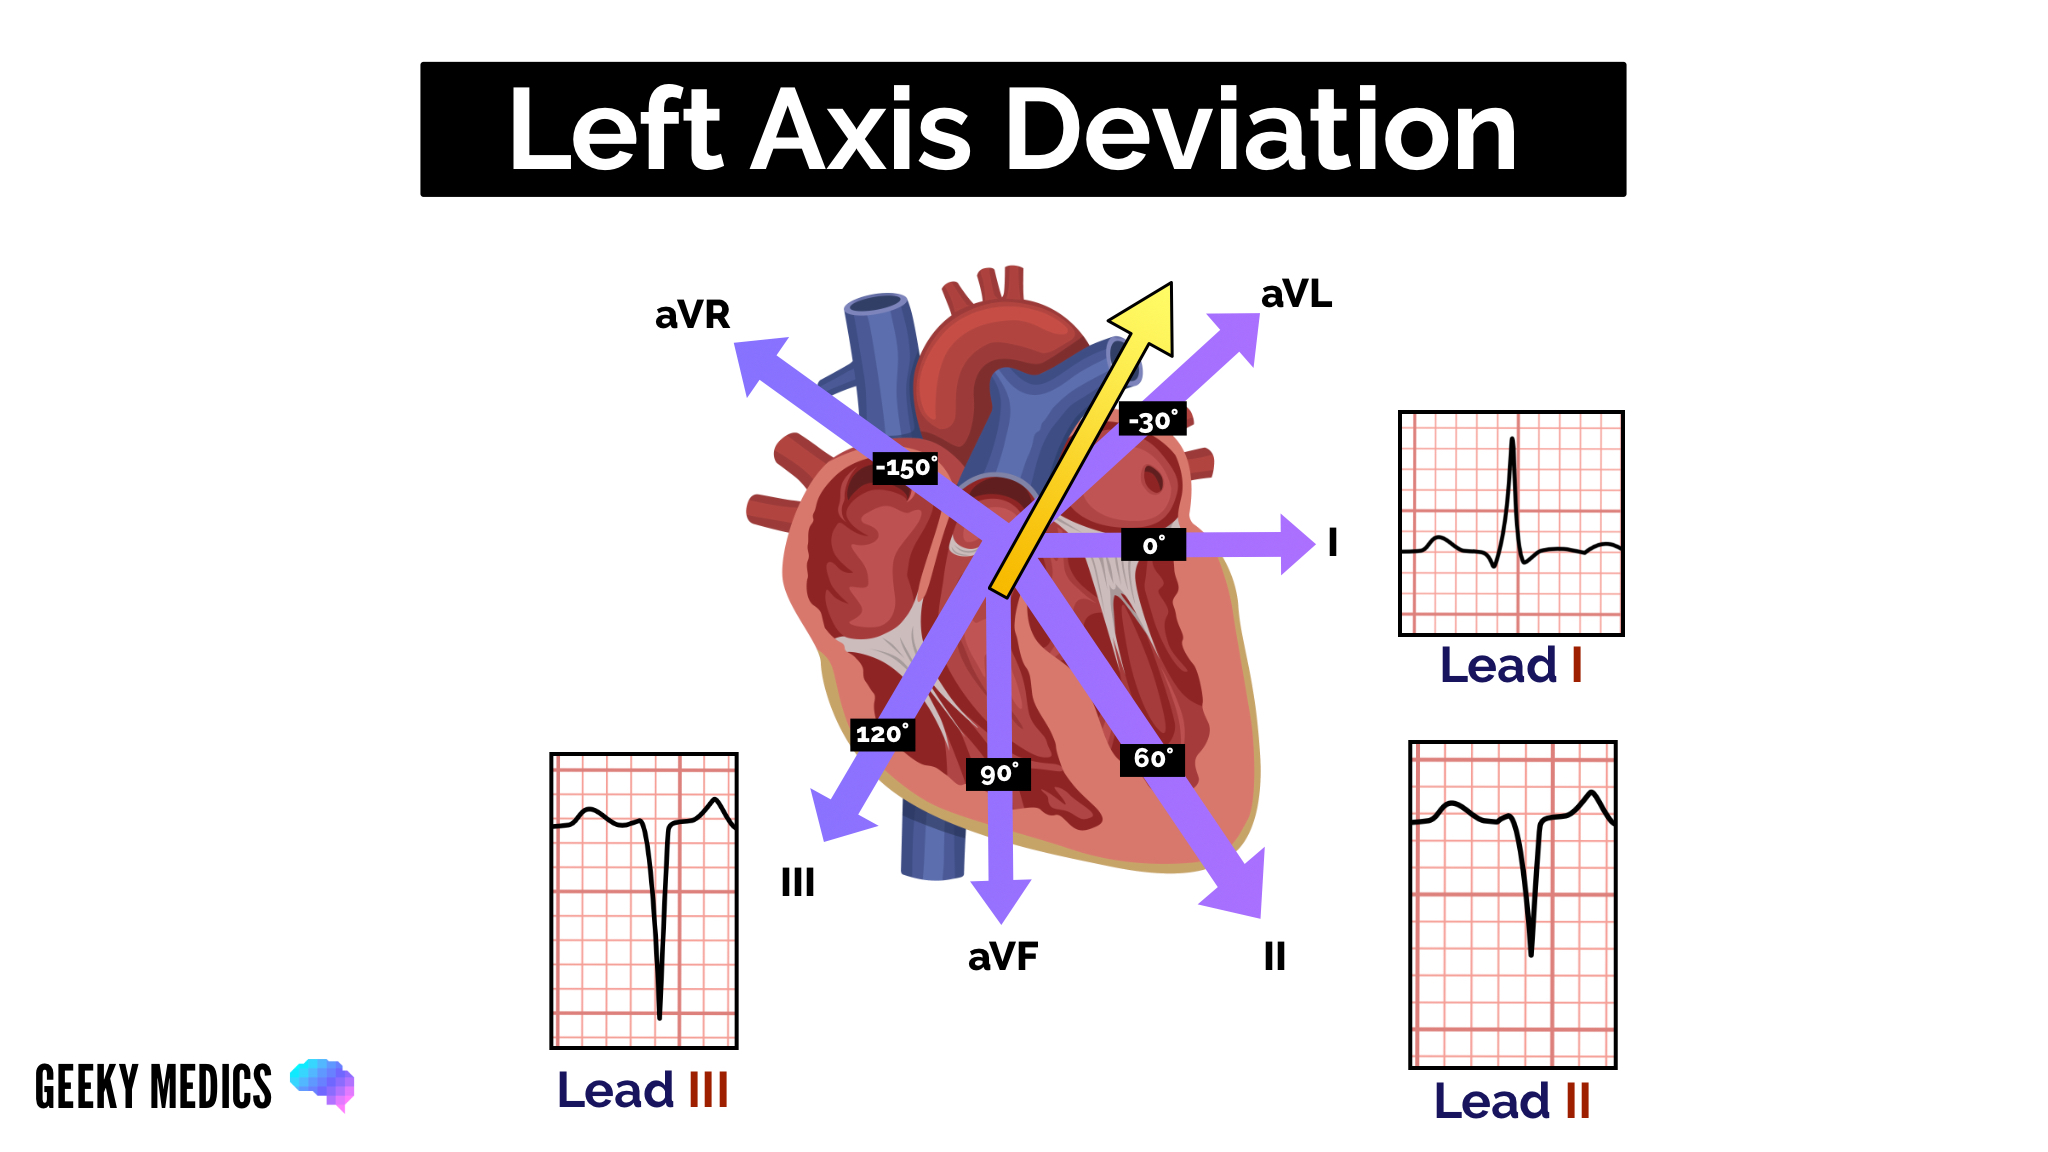
Left axis deviation
Typical ECG findings for left axis deviation:
- Lead I has the most positive deflection.
- Leads II and III are negative.
- Left axis deviation is associated with heart conduction abnormalities.
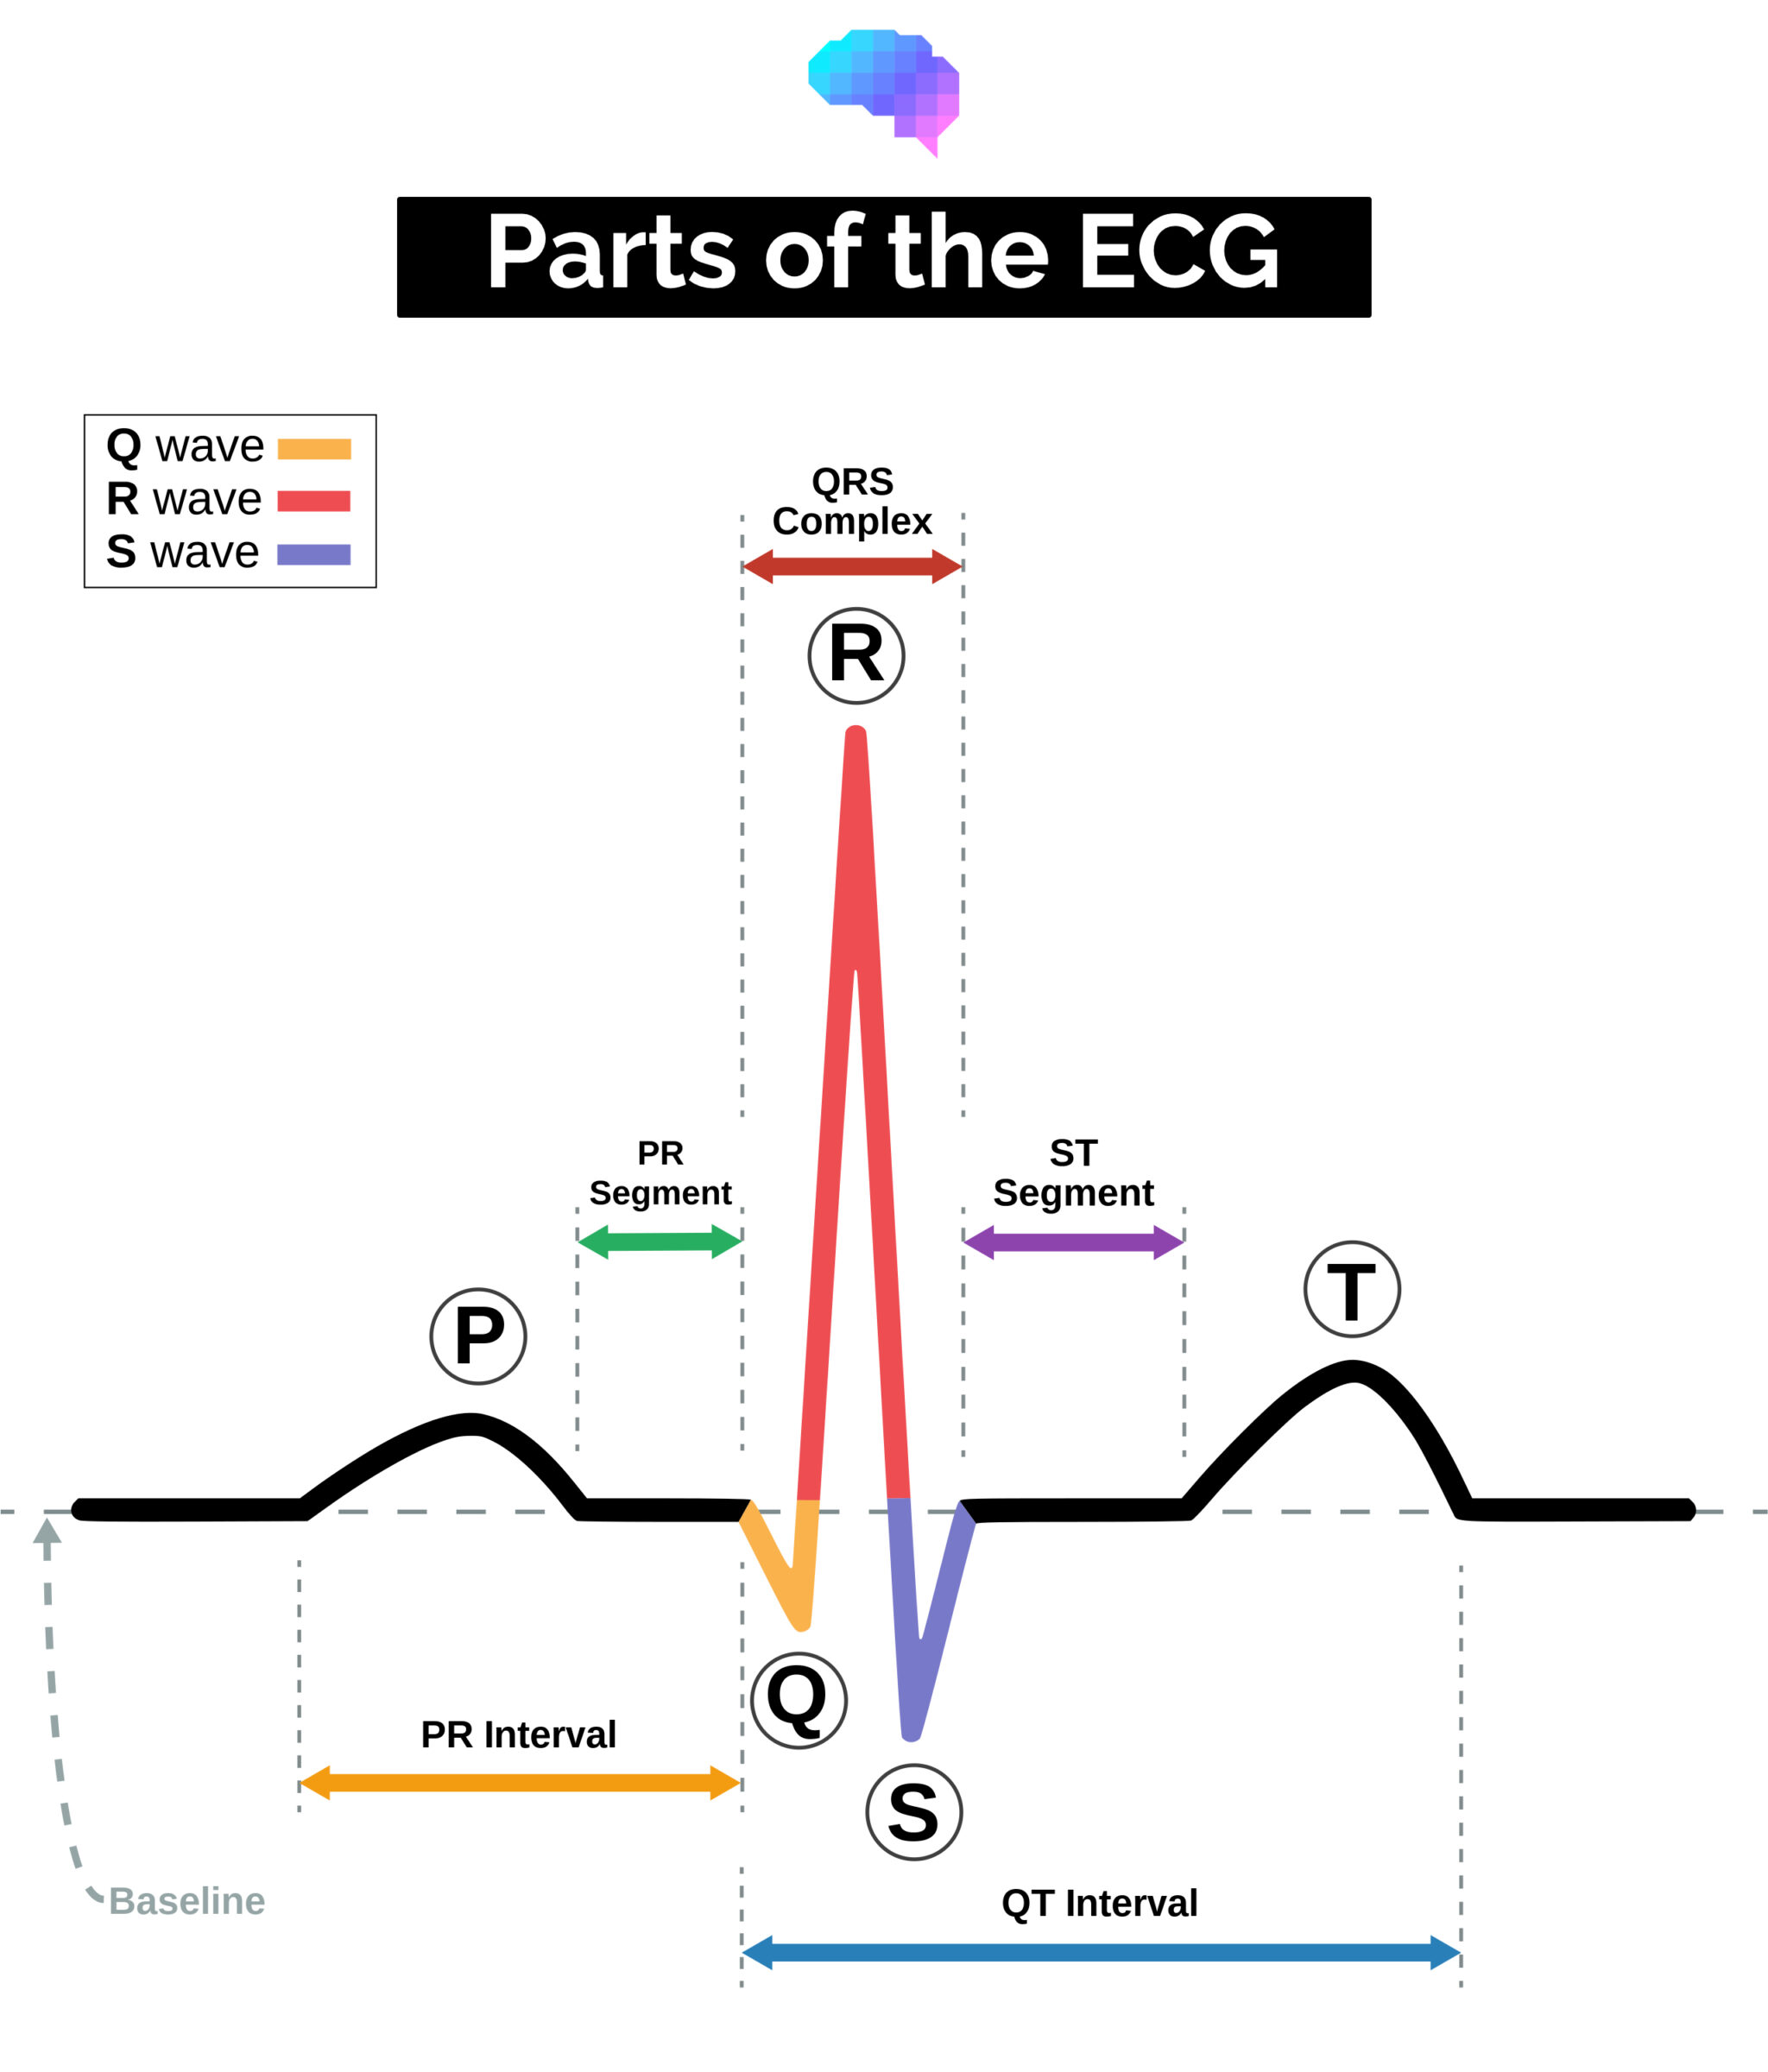
P waves
The next step is to look at the P waves and answer the following questions:
1. Are P waves present?
2. If so, is each P wave followed by a QRS complex?
3. Do the P waves look normal? – check duration, direction and shape
4. If P waves are absent, is there any atrial activity?
- Sawtooth baseline → flutter waves
- Chaotic baseline → fibrillation waves
- Flat line → no atrial activity at all
Hint
If P waves are absent and there is an irregular rhythm, it may suggest a diagnosis of atrial fibrillation.
PR interval
The PR interval should be between 120-200 ms (3-5 small squares).
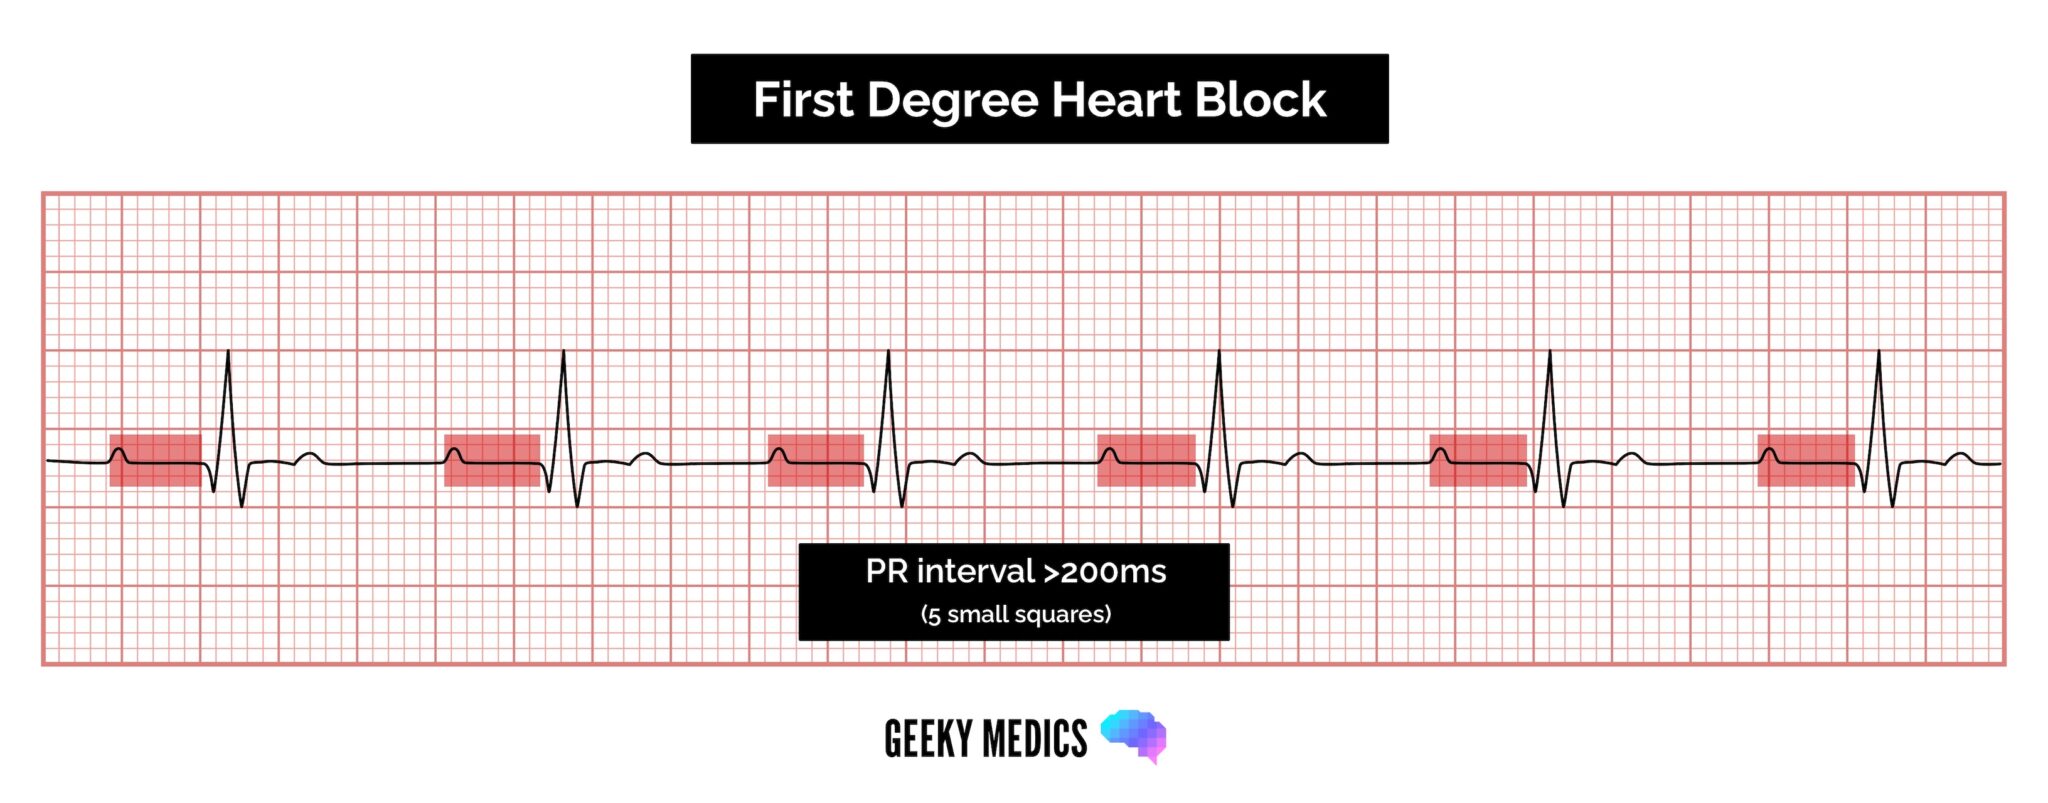
Prolonged PR interval (>0.2 seconds)
A prolonged PR interval suggests the presence of atrioventricular delay (AV block).
First-degree heart block (AV block)
First-degree heart block involves a fixed prolonged PR interval (>200 ms).
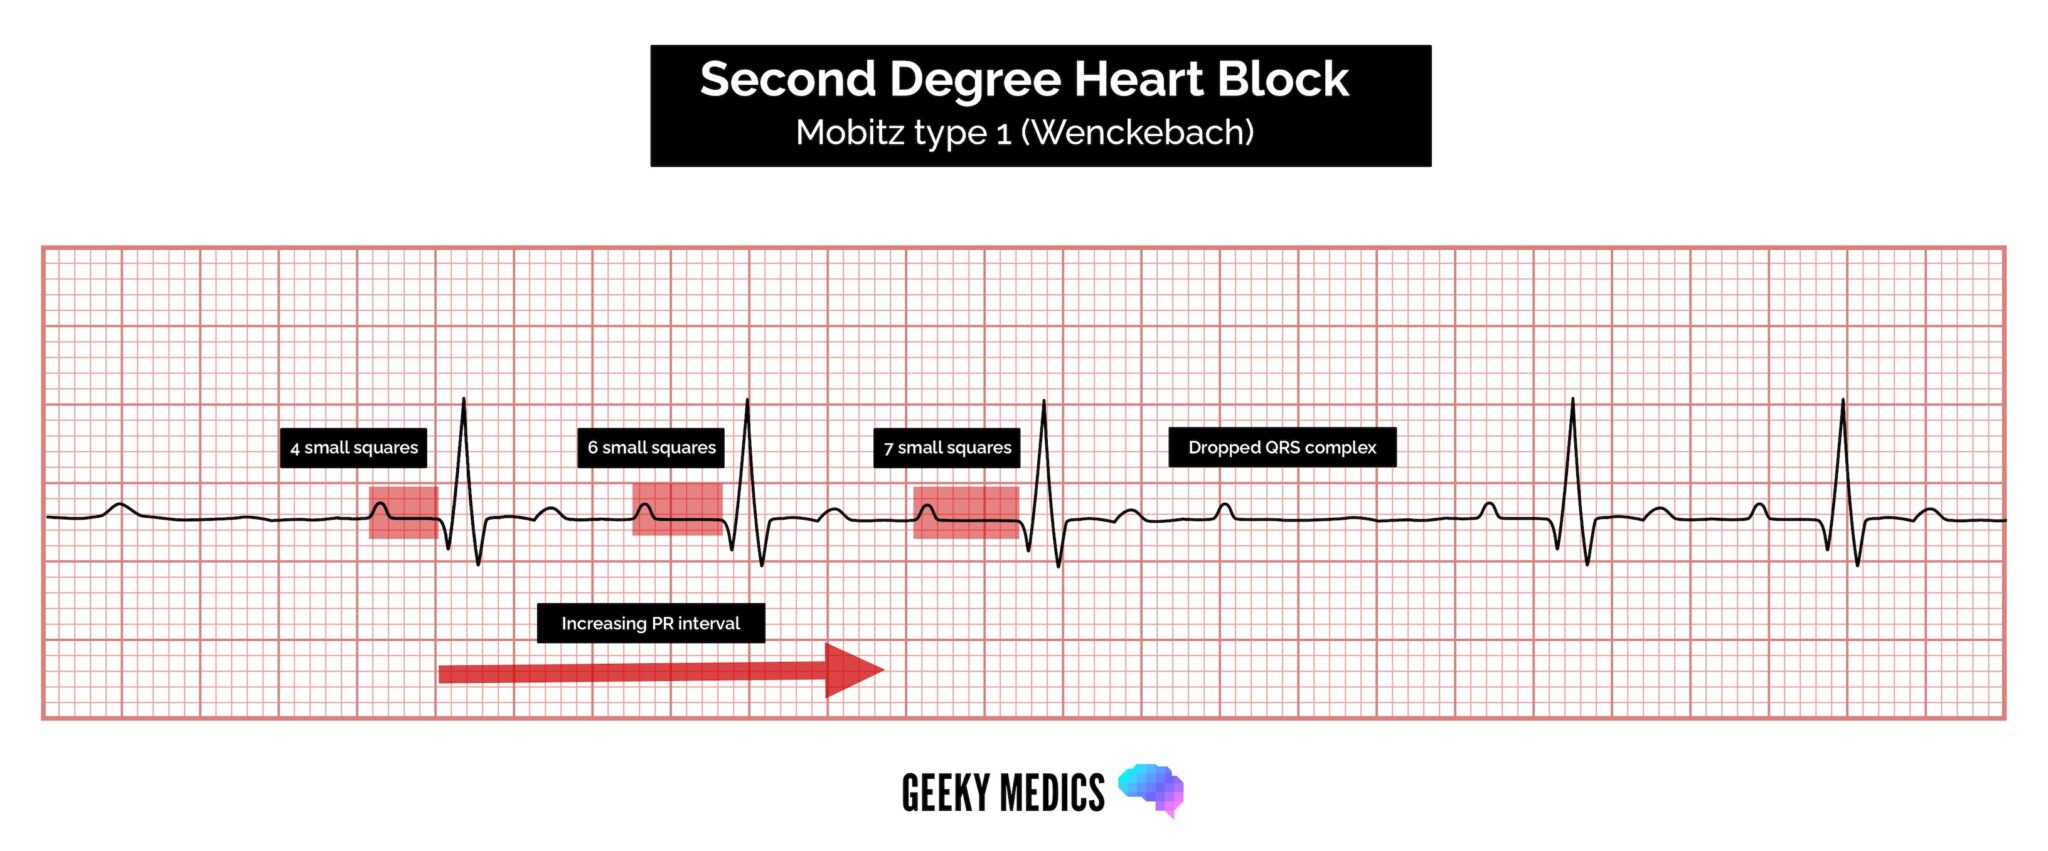
Second-degree heart block (type 1)
Second-degree AV block (type 1) is also known as Mobitz type 1 AV block or Wenckebach phenomenon.
Typical ECG findings in Mobitz type 1 AV block include progressive prolongation of the PR interval until eventually the atrial impulse is not conducted and the QRS complex is dropped.
AV nodal conduction resumes with the next beat, and the sequence of progressive PR interval prolongation and the eventual dropping of a QRS complex repeats itself.
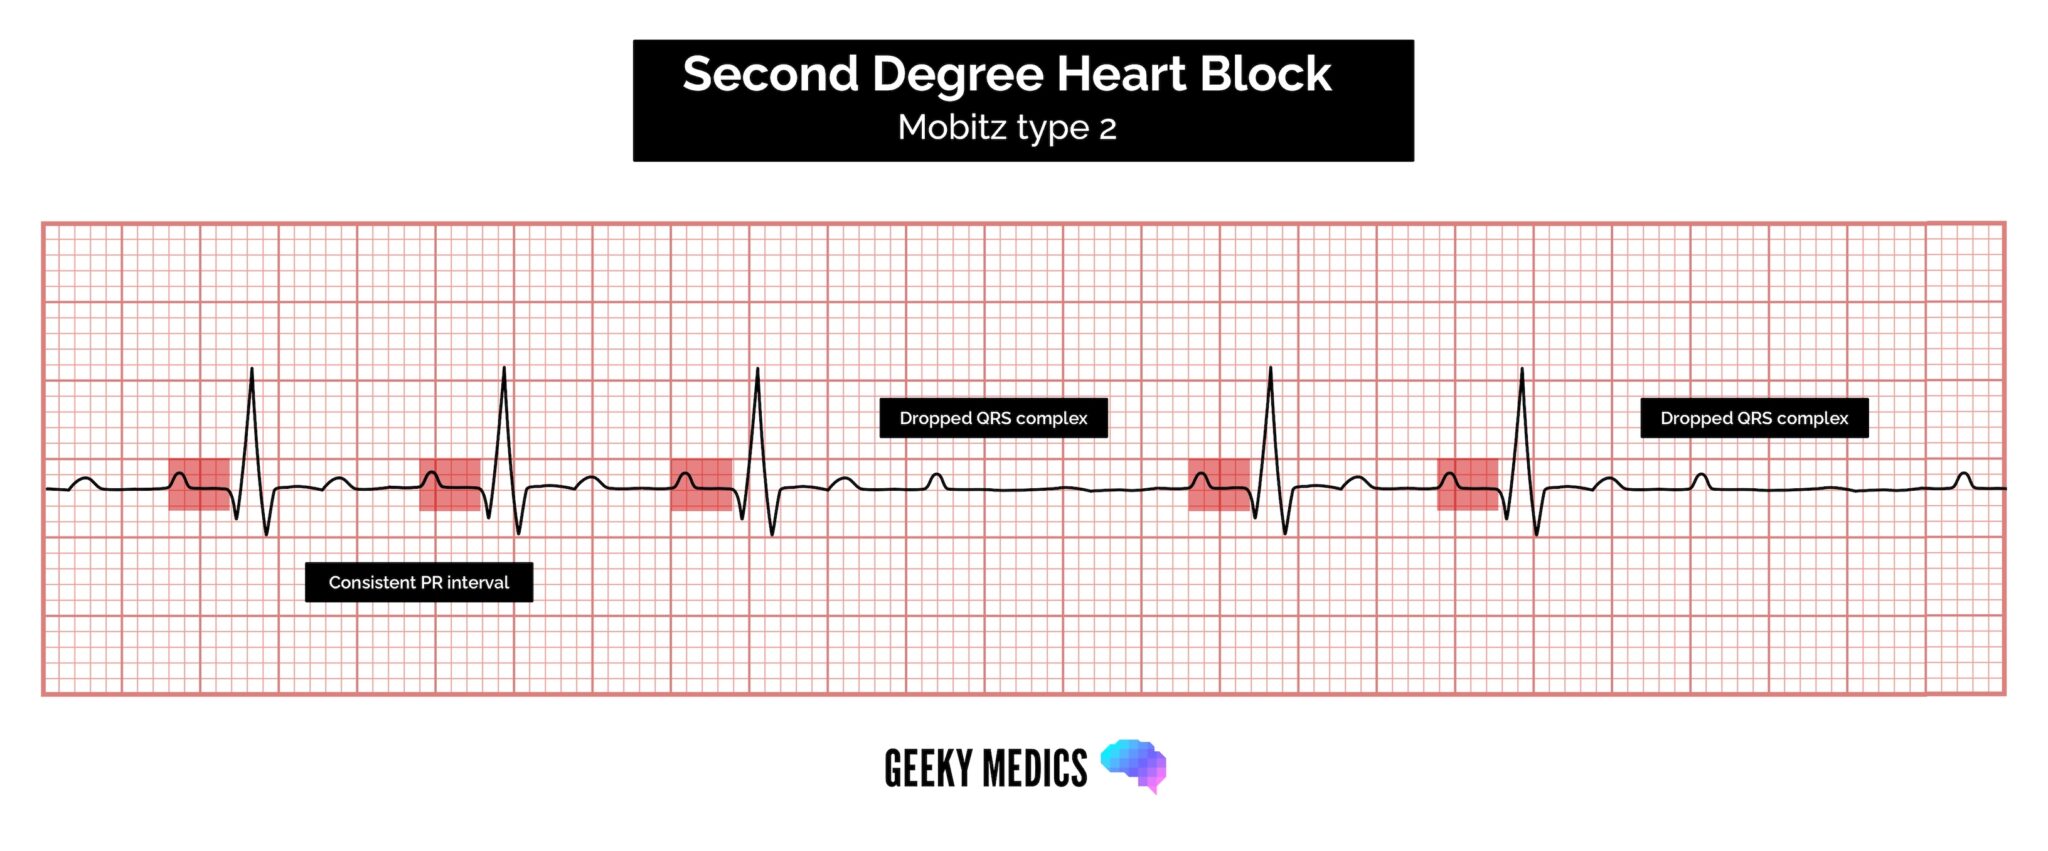
Second-degree heart block (type 2)
Second-degree AV block (type 2) is also known as Mobitz type 2 AV block.
Typical ECG findings in Mobitz type 2 AV block include a consistent PR interval duration with intermittently dropped QRS complexes due to a failure of conduction.
The intermittent dropping of the QRS complexes typically follows a repeating cycle of every 3rd (3:1 block) or 4th (4:1 block) P wave.
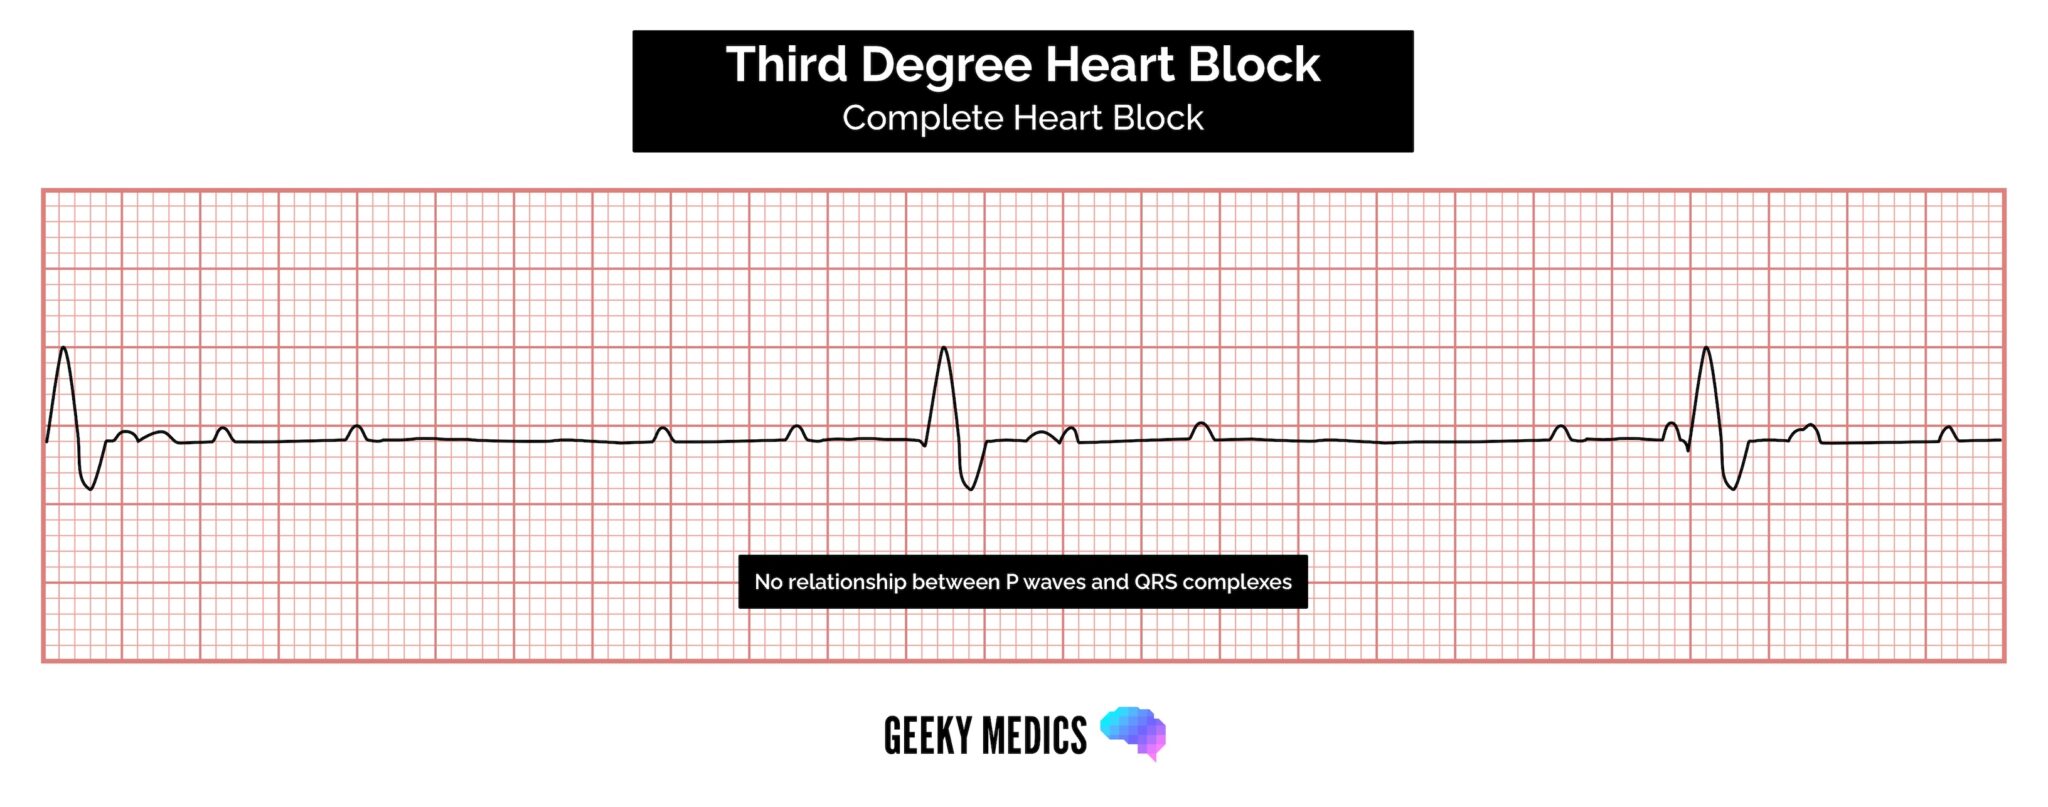
Third-degree heart block (complete heart block)
Third-degree (complete) AV block occurs when there is no electrical communication between the atria and ventricles due to a complete failure of conduction.
Typical ECG findings include the presence of P waves and QRS complexes that have no association with each other, due to the atria and ventricles functioning independently.
Cardiac function is maintained by a junctional or ventricular pacemaker.
Narrow-complex escape rhythms (QRS complexes of <0.12 seconds duration) originate above the bifurcation of the bundle of His.
Broad-complex escape rhythms (QRS complexes >0.12 seconds duration) originate from below the bifurcation of the bundle of His.
Tips for remembering types of heart block
To help remember the various types of AV block, it is useful to know the anatomical location of the block within the conducting system.
First-degree AV block:
- Occurs between the SA node and the AV node (i.e. within the atrium).
Second-degree AV block:
- Mobitz I AV block (Wenckebach) occurs IN the AV node (this is the only piece of conductive tissue in the heart which exhibits the ability to conduct at different speeds).
- Mobitz II AV block occurs AFTER the AV node in the bundle of His or Purkinje fibres.
Third-degree AV block:
- Occurs at or after the AV node resulting in a complete blockade of distal conduction.
Shortened PR interval
If the PR interval is shortened, this can mean one of two things:
- Simply, the P wave originates from somewhere closer to the AV node, so the conduction takes less time (the SA node is not in a fixed place, and some people’s atria are smaller than others).
- The atrial impulse is getting to the ventricle by a faster shortcut instead of conducting slowly across the atrial wall. This accessory pathway can be associated with a delta wave (see below).
QRS complex
When assessing a QRS complex, you need to pay attention to the following characteristics:
- Width
- Height
- Morphology
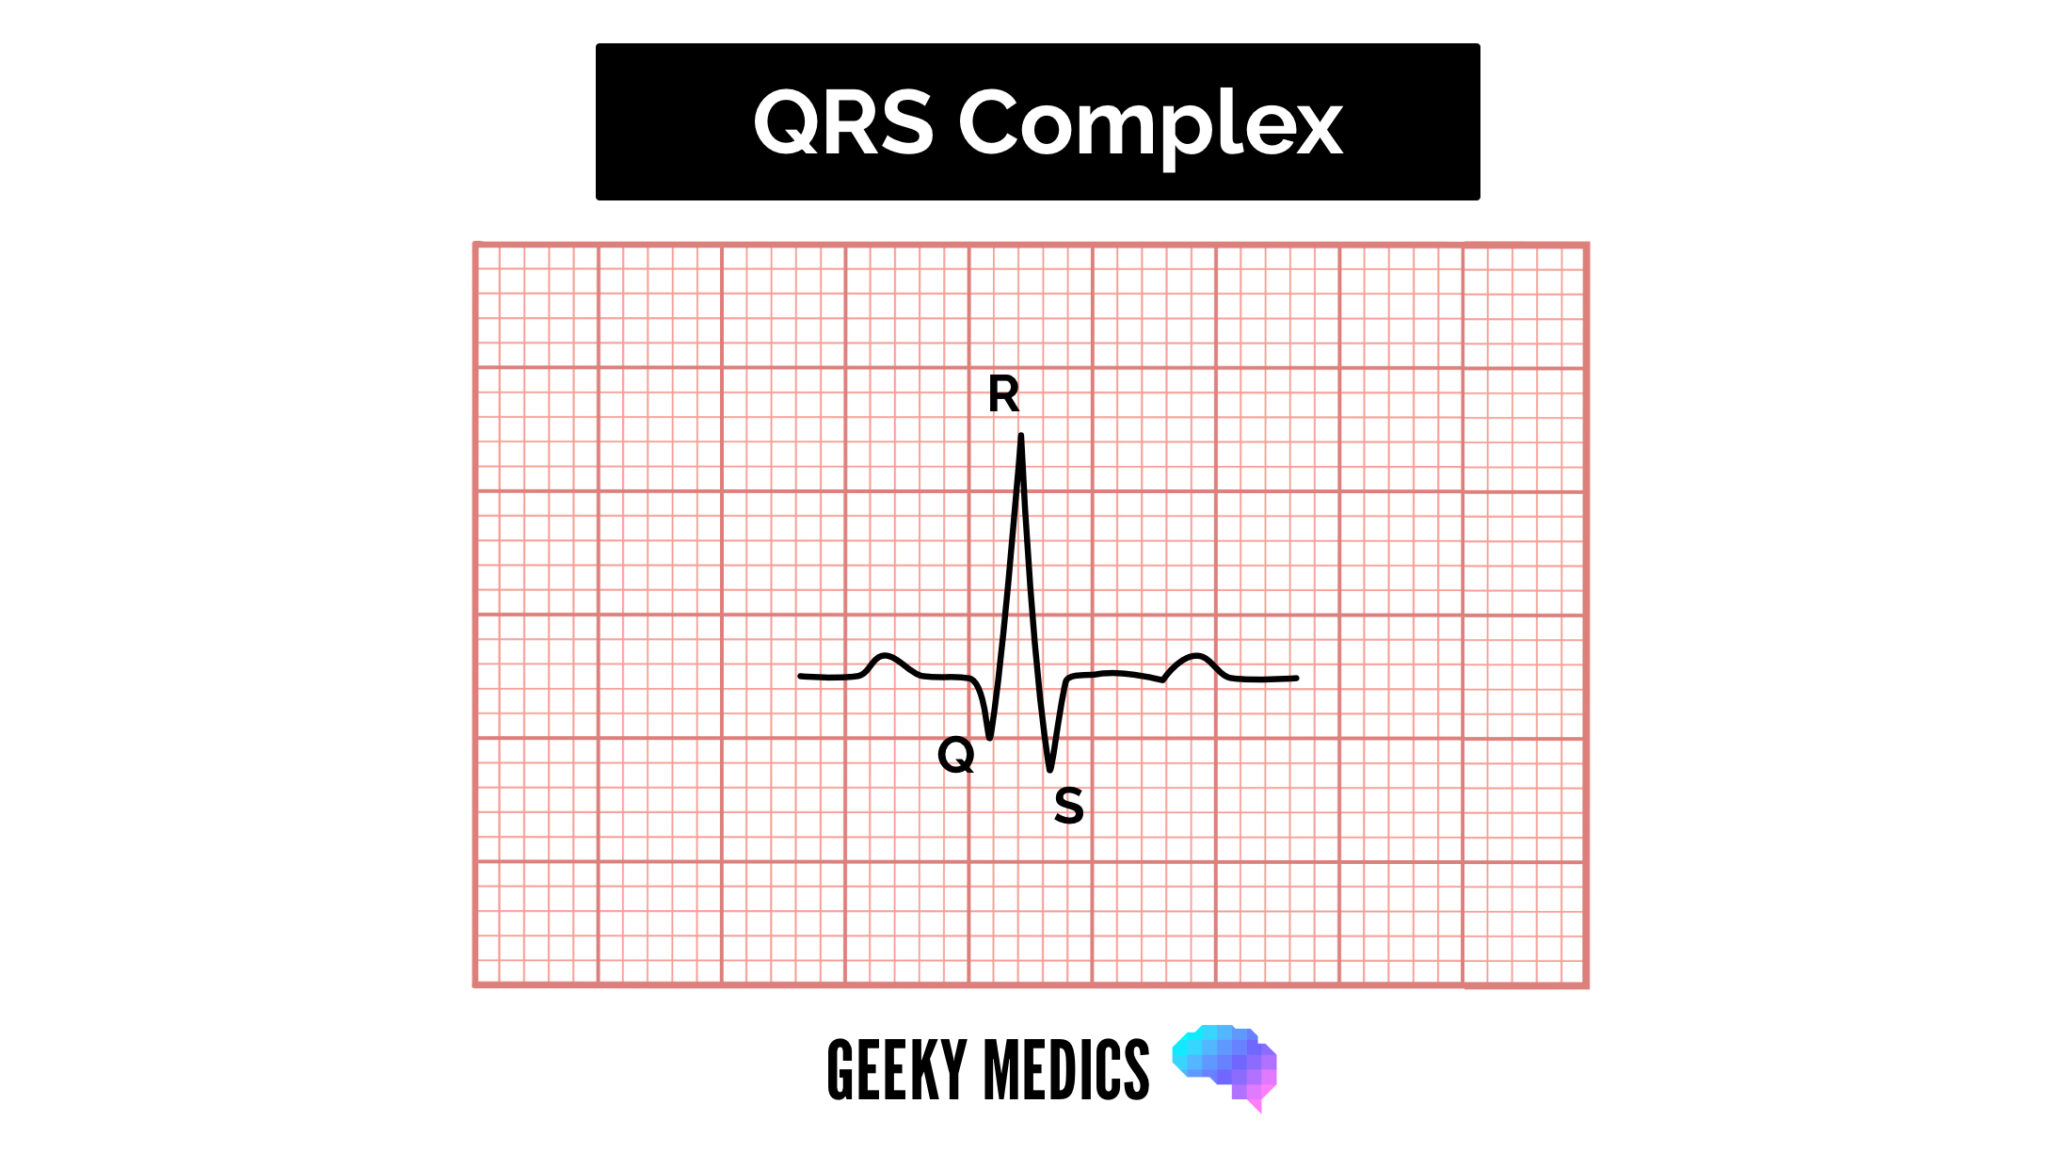
Width
The width can be described as NARROW (< 0.12 seconds) or BROAD (> 0.12 seconds):
- A narrow QRS complex occurs when the impulse is conducted down the bundle of His and the Purkinje fibre to the ventricles. This results in well organised synchronised ventricular depolarisation.
- A broad QRS complex occurs if there is an abnormal depolarisation sequence – for example, a ventricular ectopic where the impulse spreads slowly across the myocardium from the focus in the ventricle. In contrast, an atrial ectopic would result in a narrow QRS complex because it would conduct down the heart’s normal conduction system. Similarly, a bundle branch block results in a broad QRS complex because the impulse gets to one ventricle rapidly down the intrinsic conduction system and then spreads slowly across the myocardium to the other ventricle.
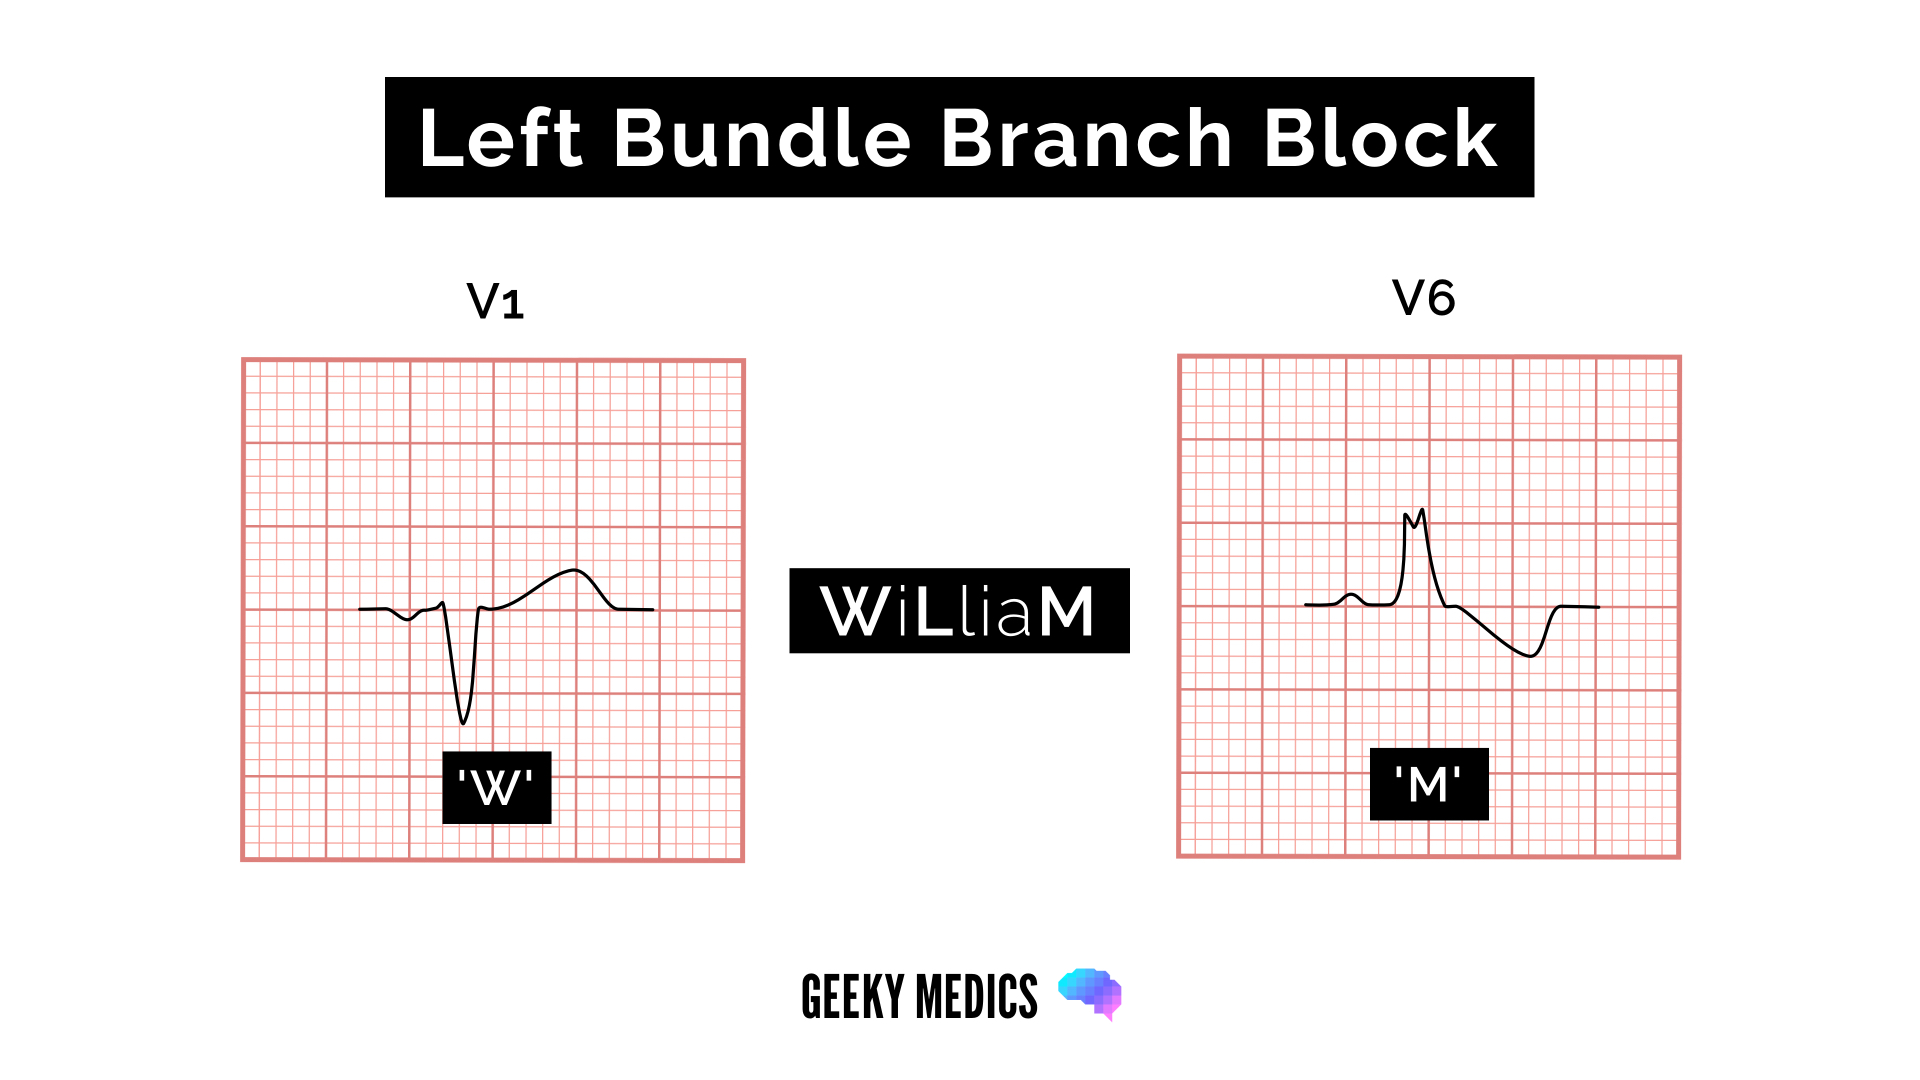
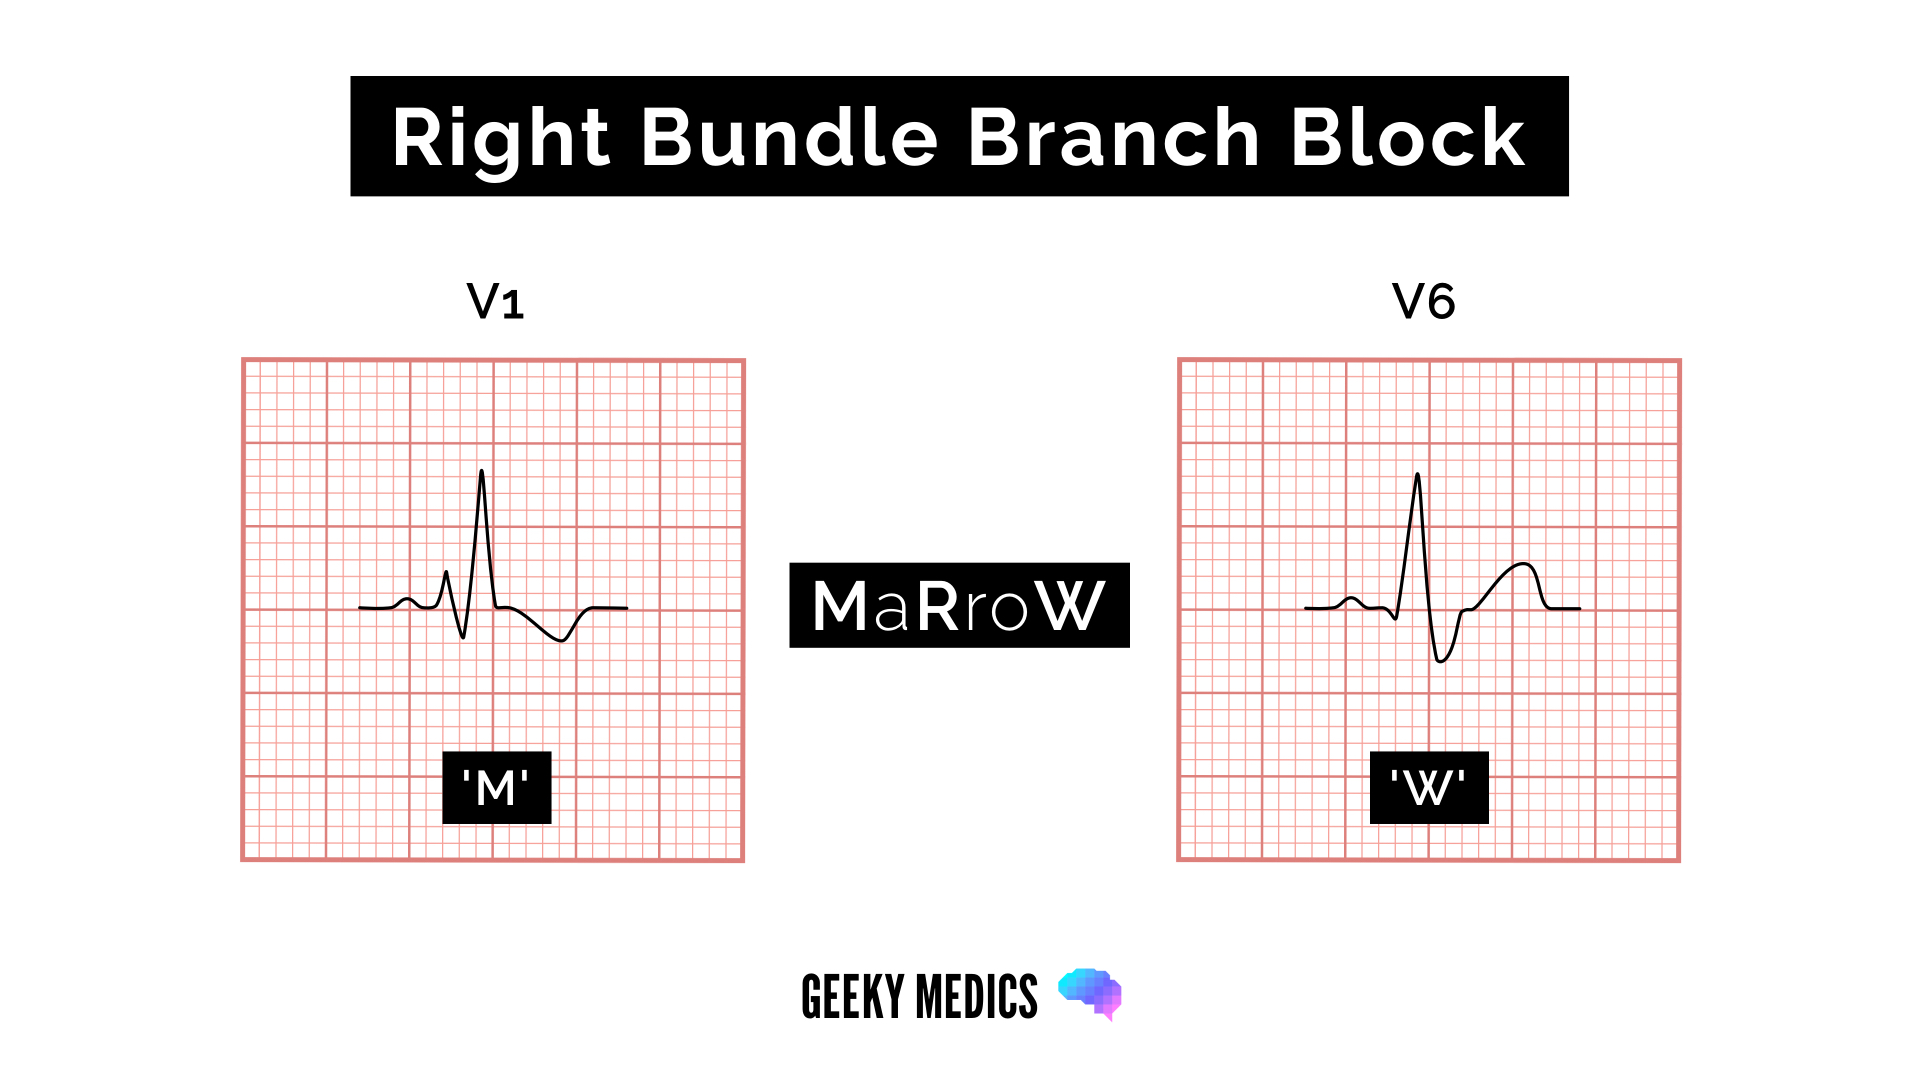
Bundle branch block
Broad QRS complexes are a hallmark feature of bundle branch block, which includes left bundle branch block (LBBB) and right bundle branch block (RBBB).
The WiLLiaM MaRRoW mnemonic can be used to quickly recognise left and right bundle branch blocks by looking at V1 and V6.
The middle letters of the names help you remember which bundle branch block each name is referring two (two Ls in WiLLiaM = left bundle branch block, two Rs in MaRRoW = right bundle branch block).
Each name’s first and last letter helps you recognise the ECG features of the associated bundle branch block.
- LBBB: deep S wave in V1 which may be notched (“W”) and broad “M” shaped R wave in V6
- RBBB: RSR’ pattern in V1 (“M”) and broad S wave in V6 (“W”)
Height
Height can be described as either SMALL or TALL:
- Small complexes are defined as < 5mm in the limb leads or < 10 mm in the chest leads.
- Tall complexes imply ventricular hypertrophy (although can be due to body habitus e.g. tall slim people). There are numerous algorithms for measuring LVH, such as the Sokolow-Lyon index or the Cornell index.
Morphology
To assess morphology, you need to assess the individual waves of the QRS complex.
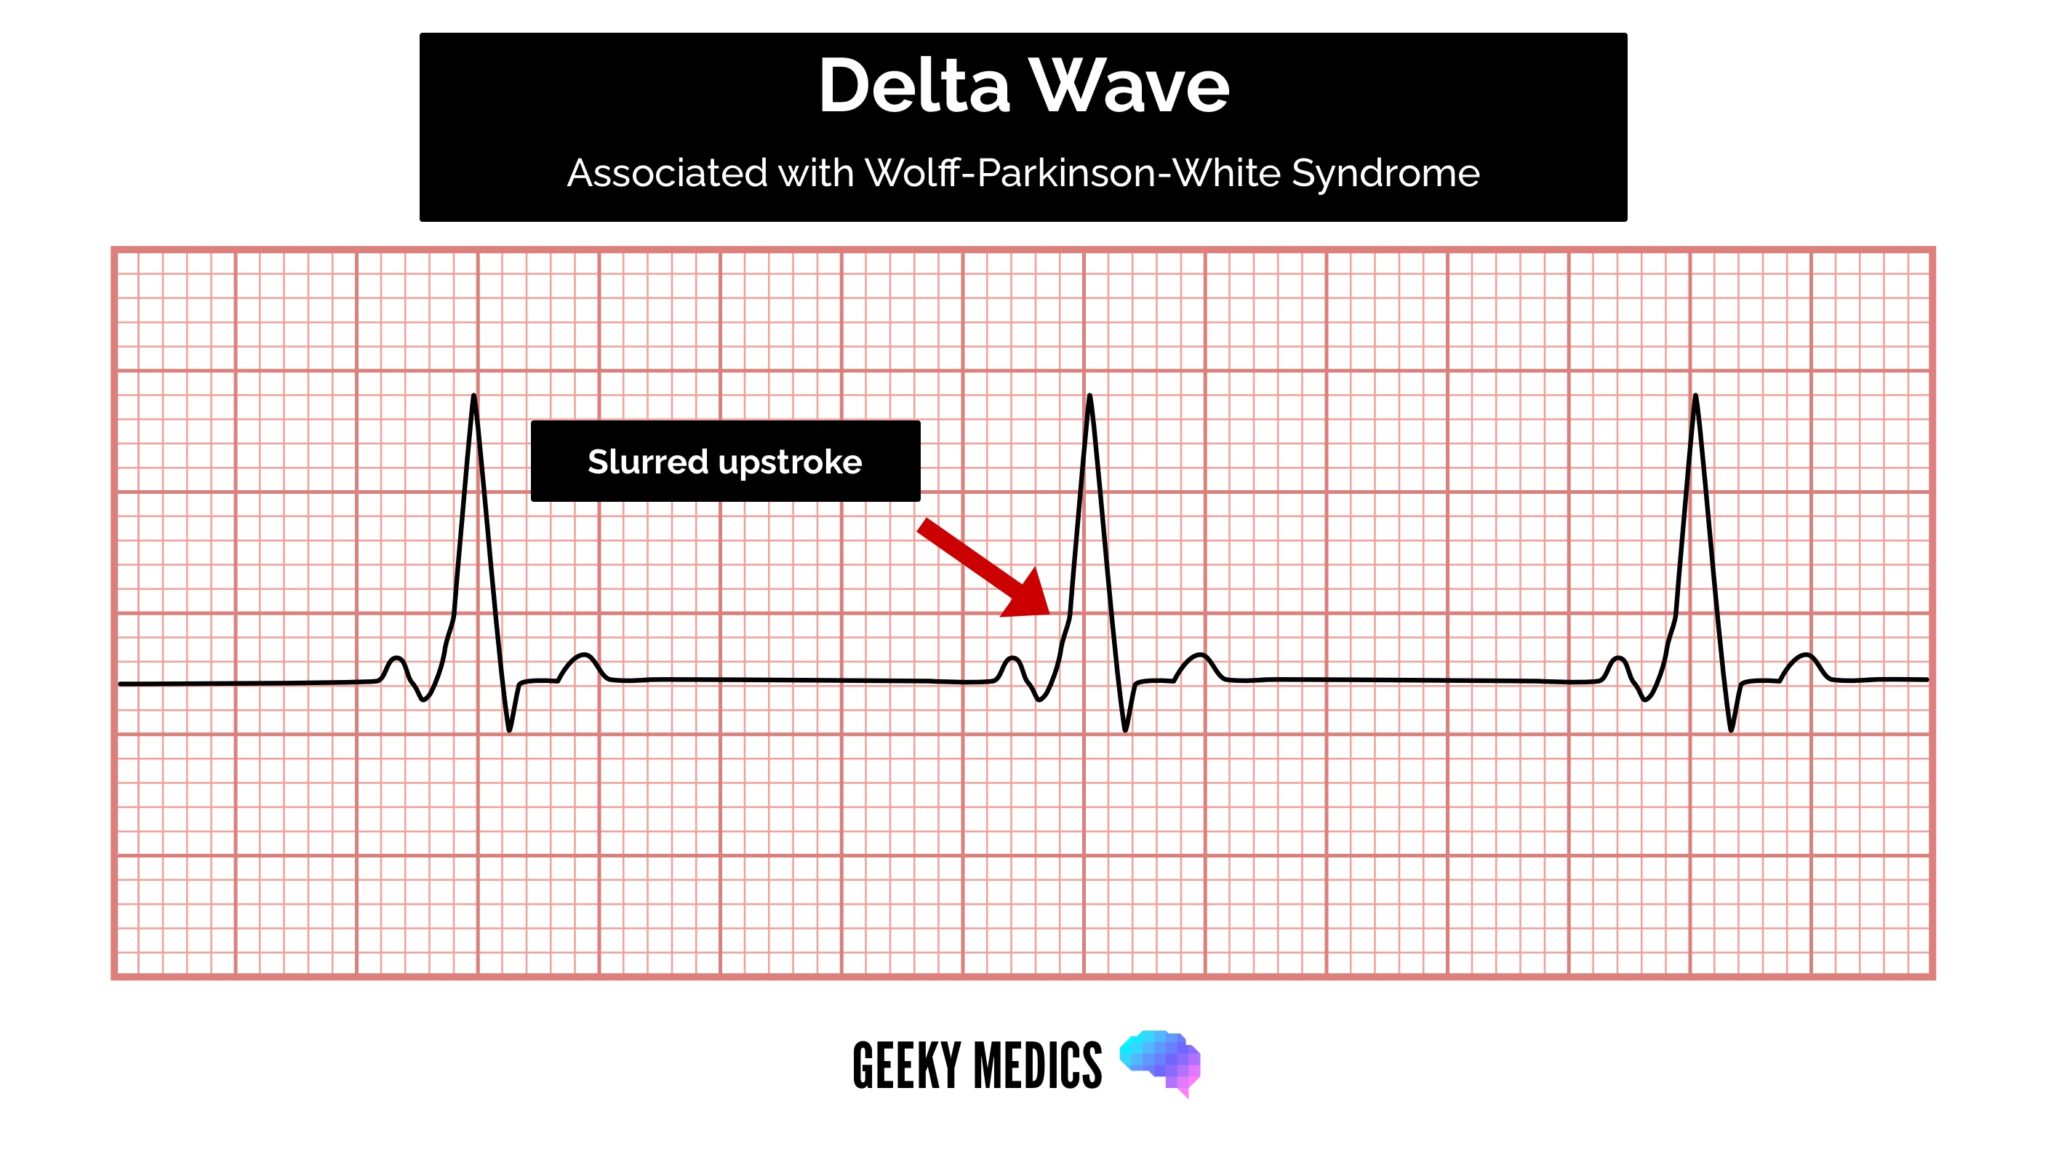
Delta wave
The mythical ‘delta wave‘ indicates that the ventricles are being activated earlier than normal from a point distant from the AV node. The early activation then spreads slowly across the myocardium, causing the QRS complex’s slurred upstroke.
The presence of a delta wave does NOT diagnose Wolff-Parkinson-White syndrome. This requires evidence of tachyarrhythmias AND a delta wave.
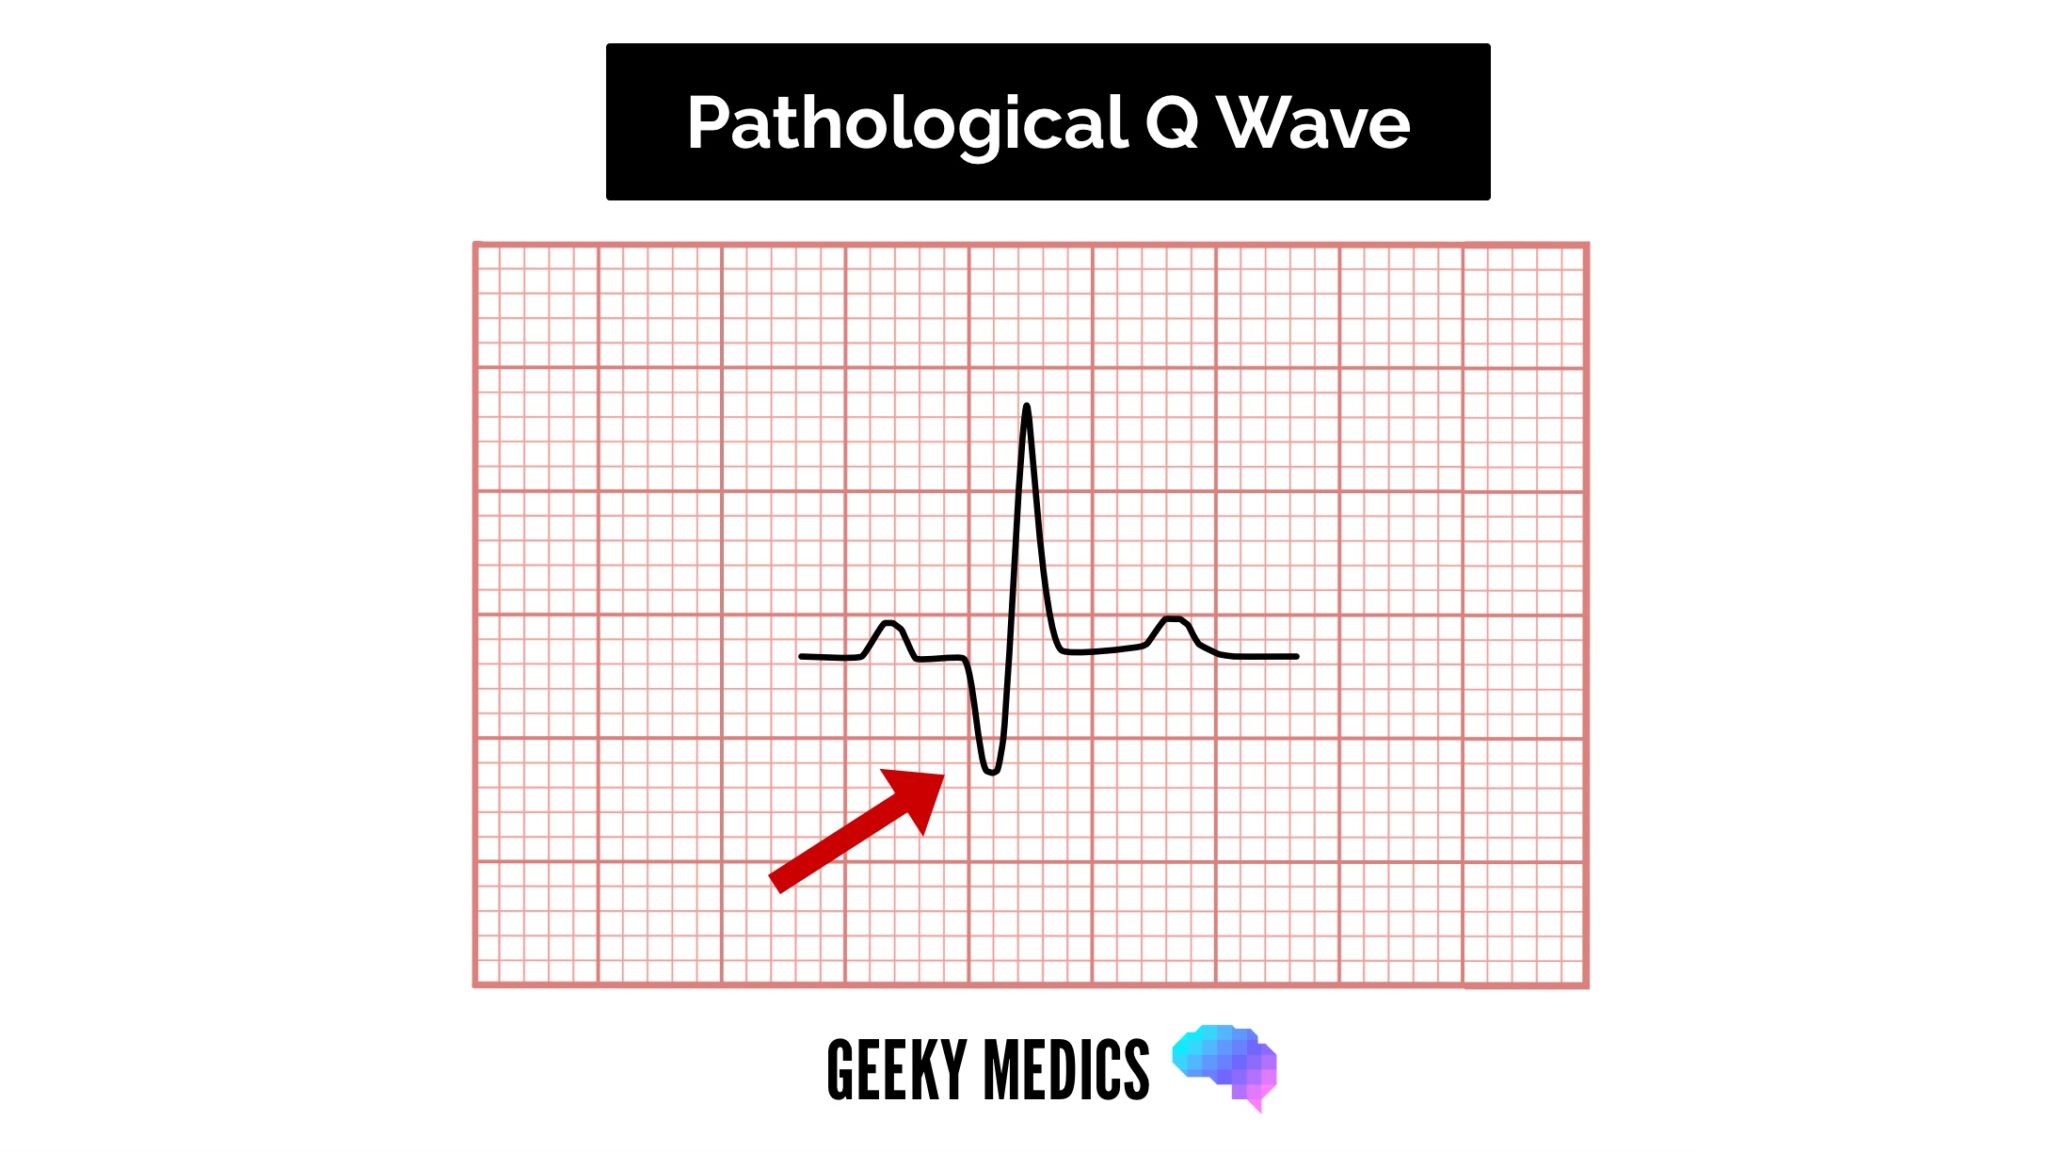
Q-waves
Isolated Q waves can be normal.
A pathological Q wave is > 25% the size of the R wave that follows it or > 2mm in height and > 40ms in width.
A single Q wave is not a cause for concern – look for Q waves in an entire territory (e.g. anterior/inferior) for evidence of previous myocardial infarction.
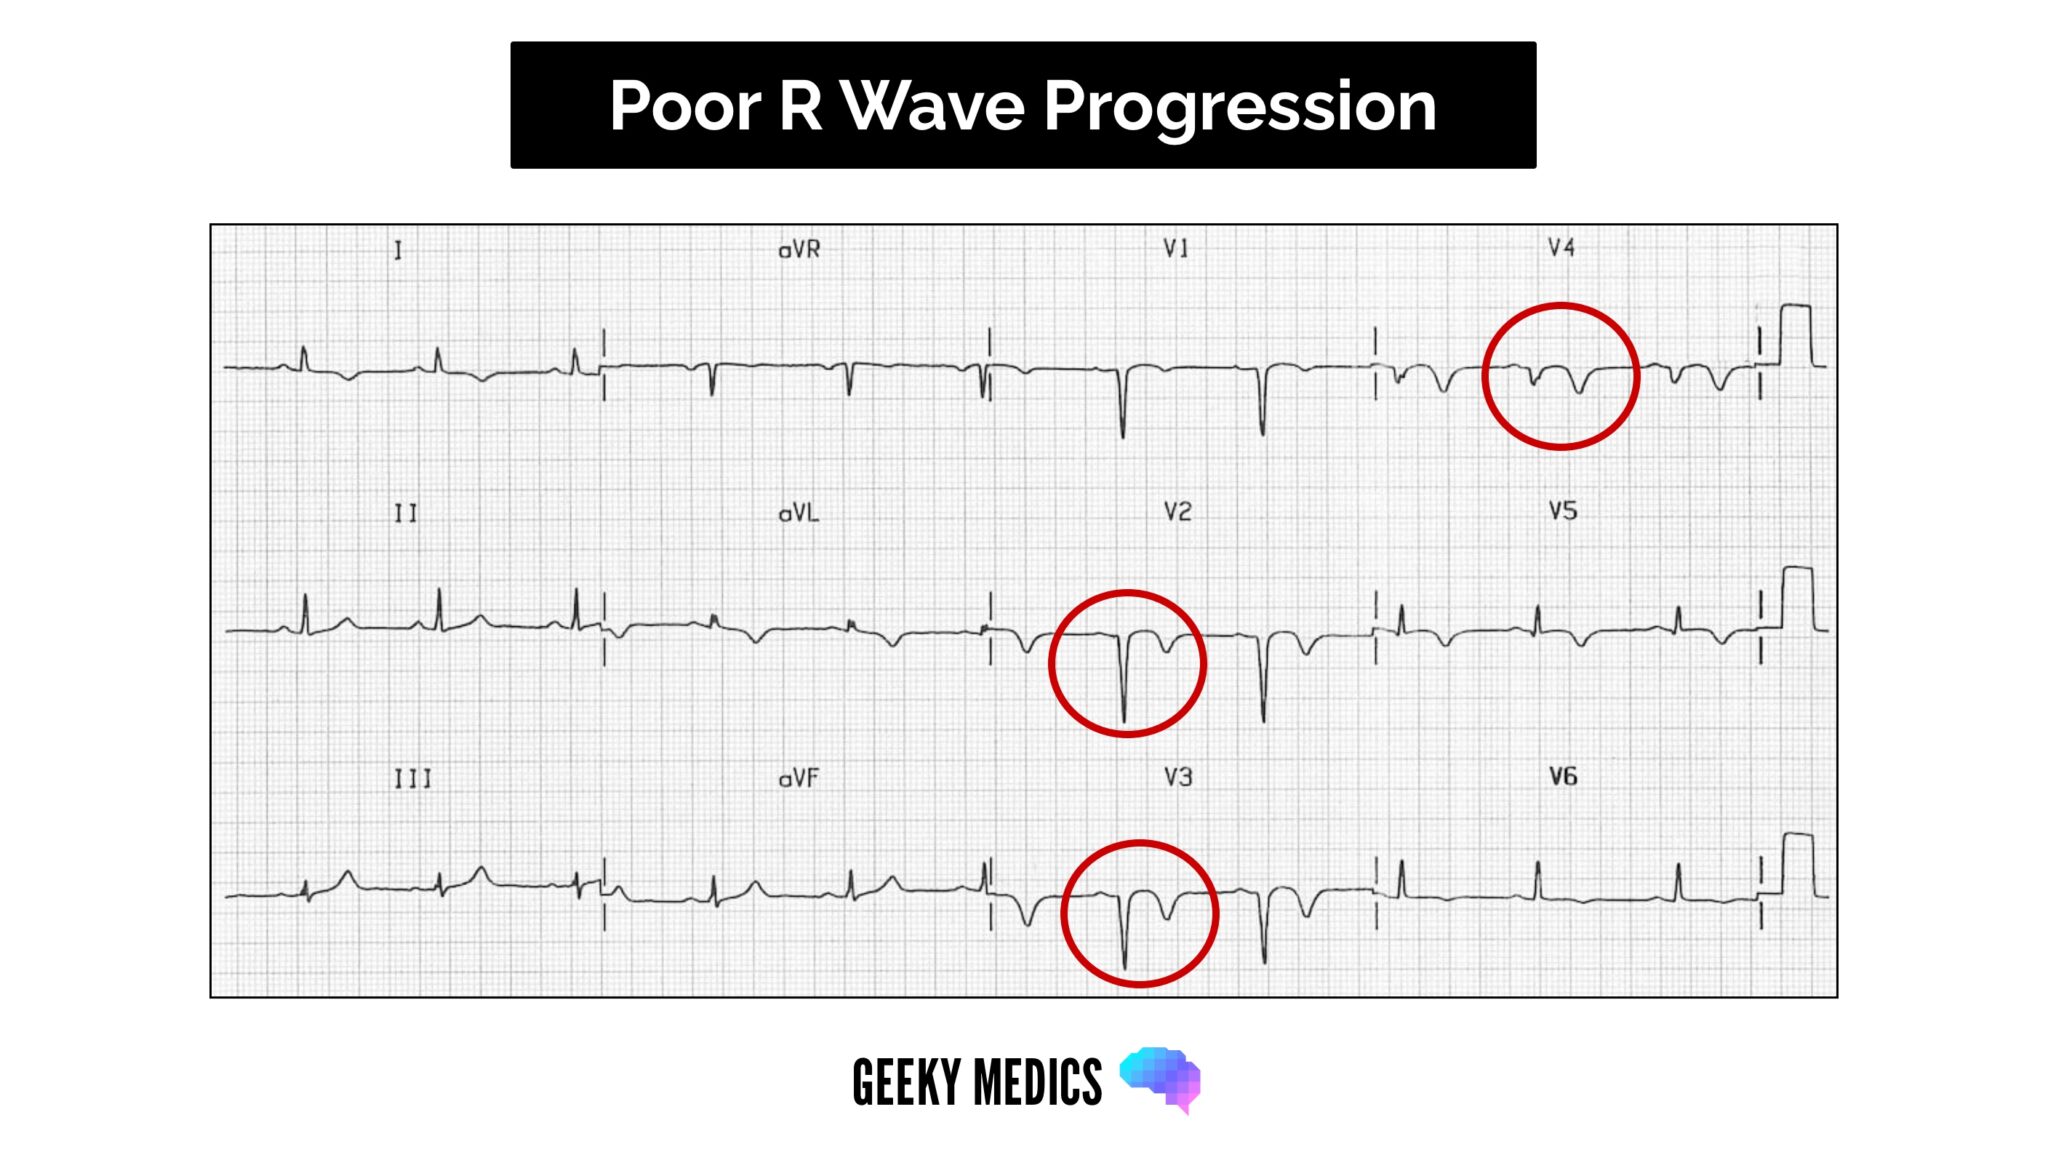
R and S waves
Assess the R wave progression across the chest leads (from small in V1 to large in V6).
The transition from S > R wave to R > S wave should occur in V3 or V4.
Poor progression (i.e. S > R through to leads V5 and V6) can be a sign of previous MI but can also occur in very large people due to poor lead position.
J point segment
The J point is where the S wave joins the ST segment.
This point can be elevated, resulting in the ST segment that follows it being raised (this is known as “high take-off”).
High take-off (or benign early repolarisation) is a normal variant that causes a lot of angst and confusion as it LOOKS like ST elevation.
Key points for assessing the J point segment:
- Benign early repolarisation occurs mostly under the age of 50 (over the age of 50, ischaemia is more common and should be suspected first).
- Typically, the J point is raised with widespread ST elevation in multiple territories making ischaemia less likely.
- The T waves are also raised (in contrast to a STEMI, where the T wave remains the same size and the ST segment is raised).
- The ECG abnormalities do not change! During a STEMI, the changes will evolve – in benign early repolarisation, they will remain the same.
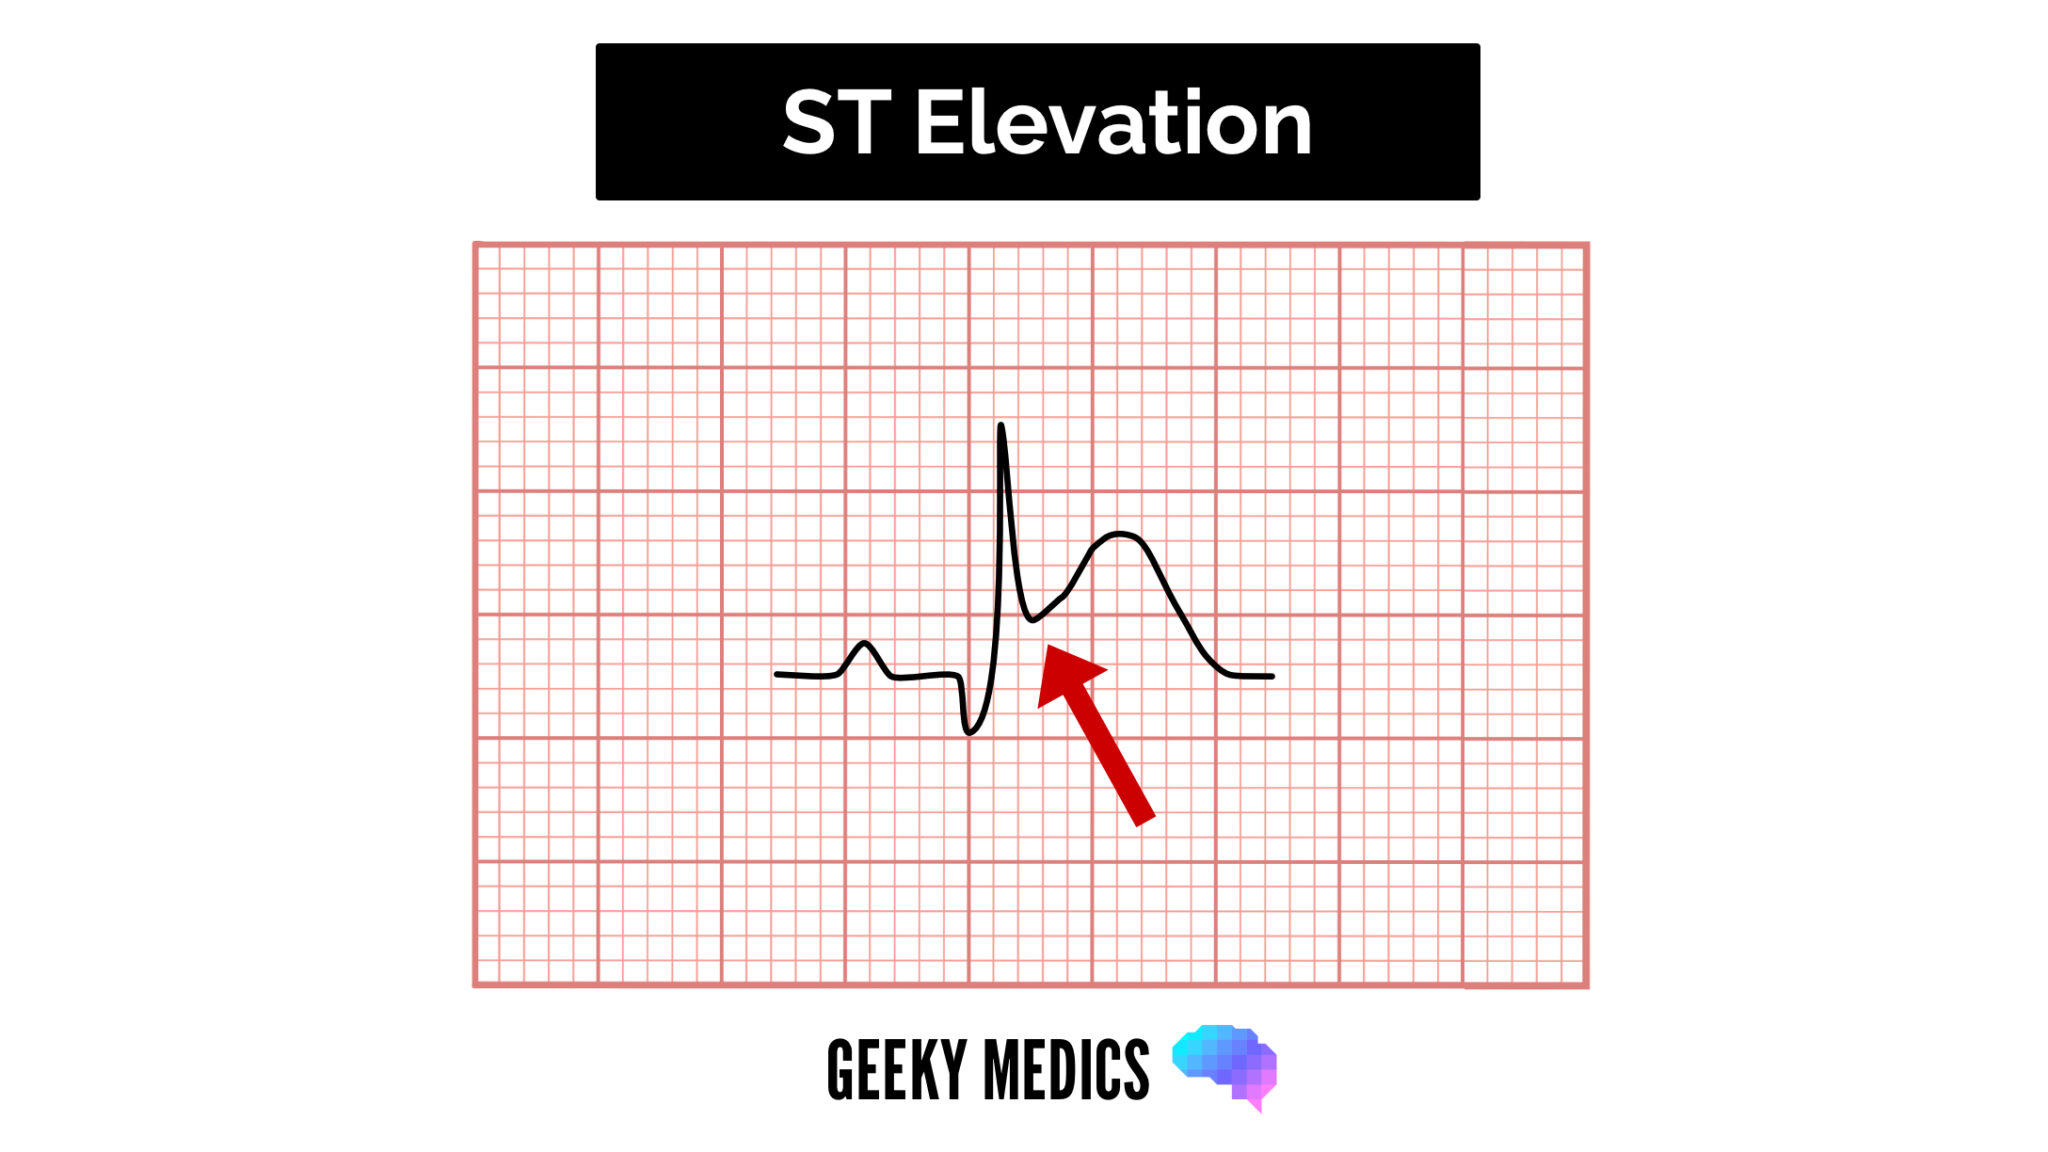
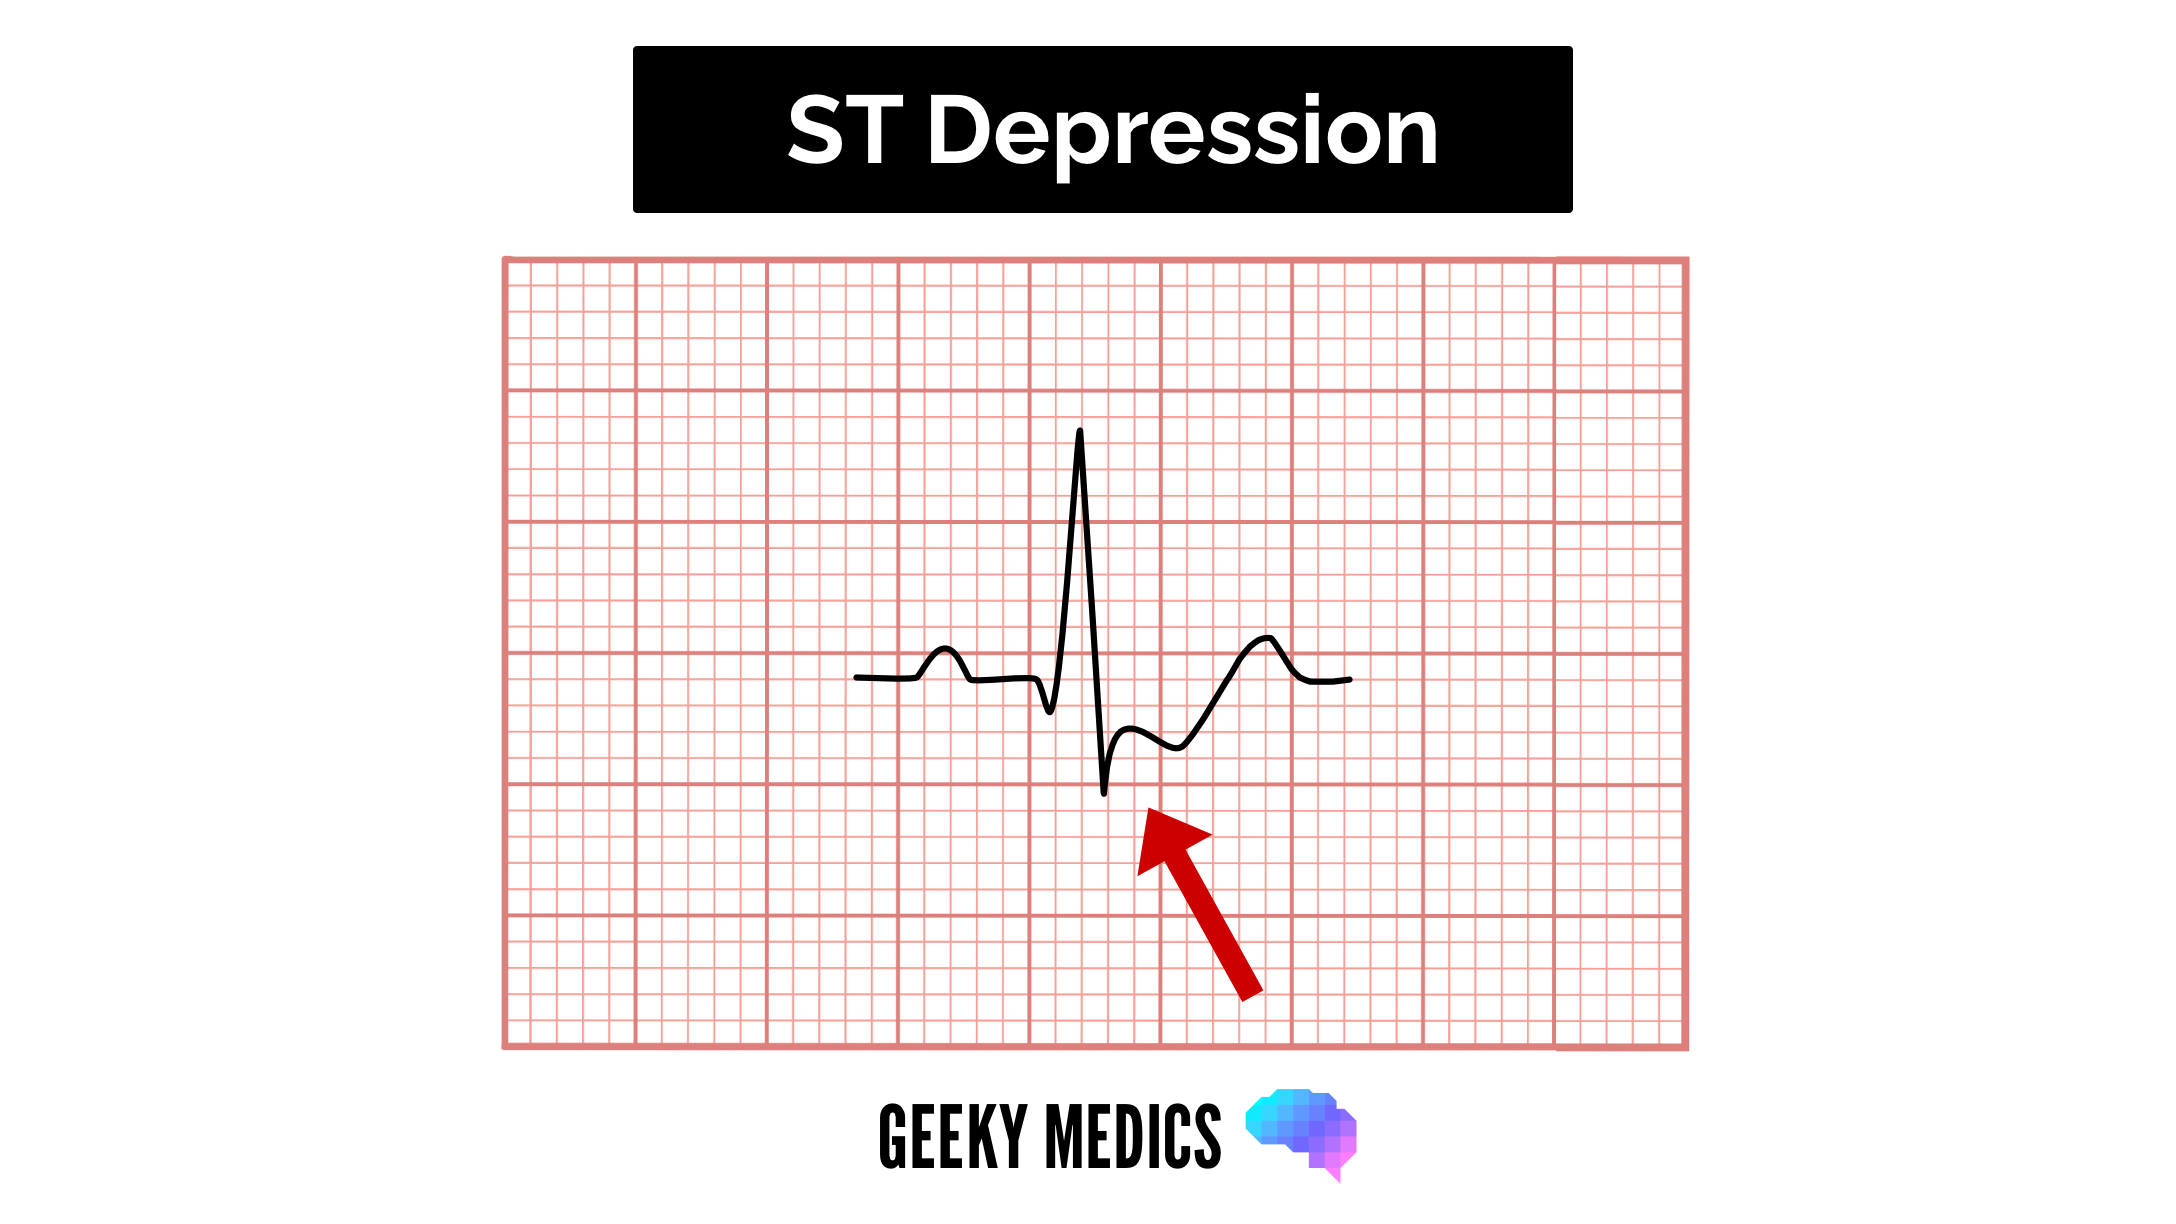
ST segment
The ST segment is the part of the ECG between the end of the S wave and the start of the T wave.
In a healthy individual, it should be an isoelectric line (neither elevated nor depressed).
Abnormalities of the ST segment should be investigated to rule out pathology.
ST-elevation
ST-elevation is significant when it is greater than 1 mm (1 small square) in 2 or more contiguous limb leads or >2mm in 2 or more chest leads.
It is most commonly caused by acute full-thickness myocardial infarction.
ST depression
ST depression ≥ 0.5 mm in ≥ 2 contiguous leads indicates myocardial ischaemia.
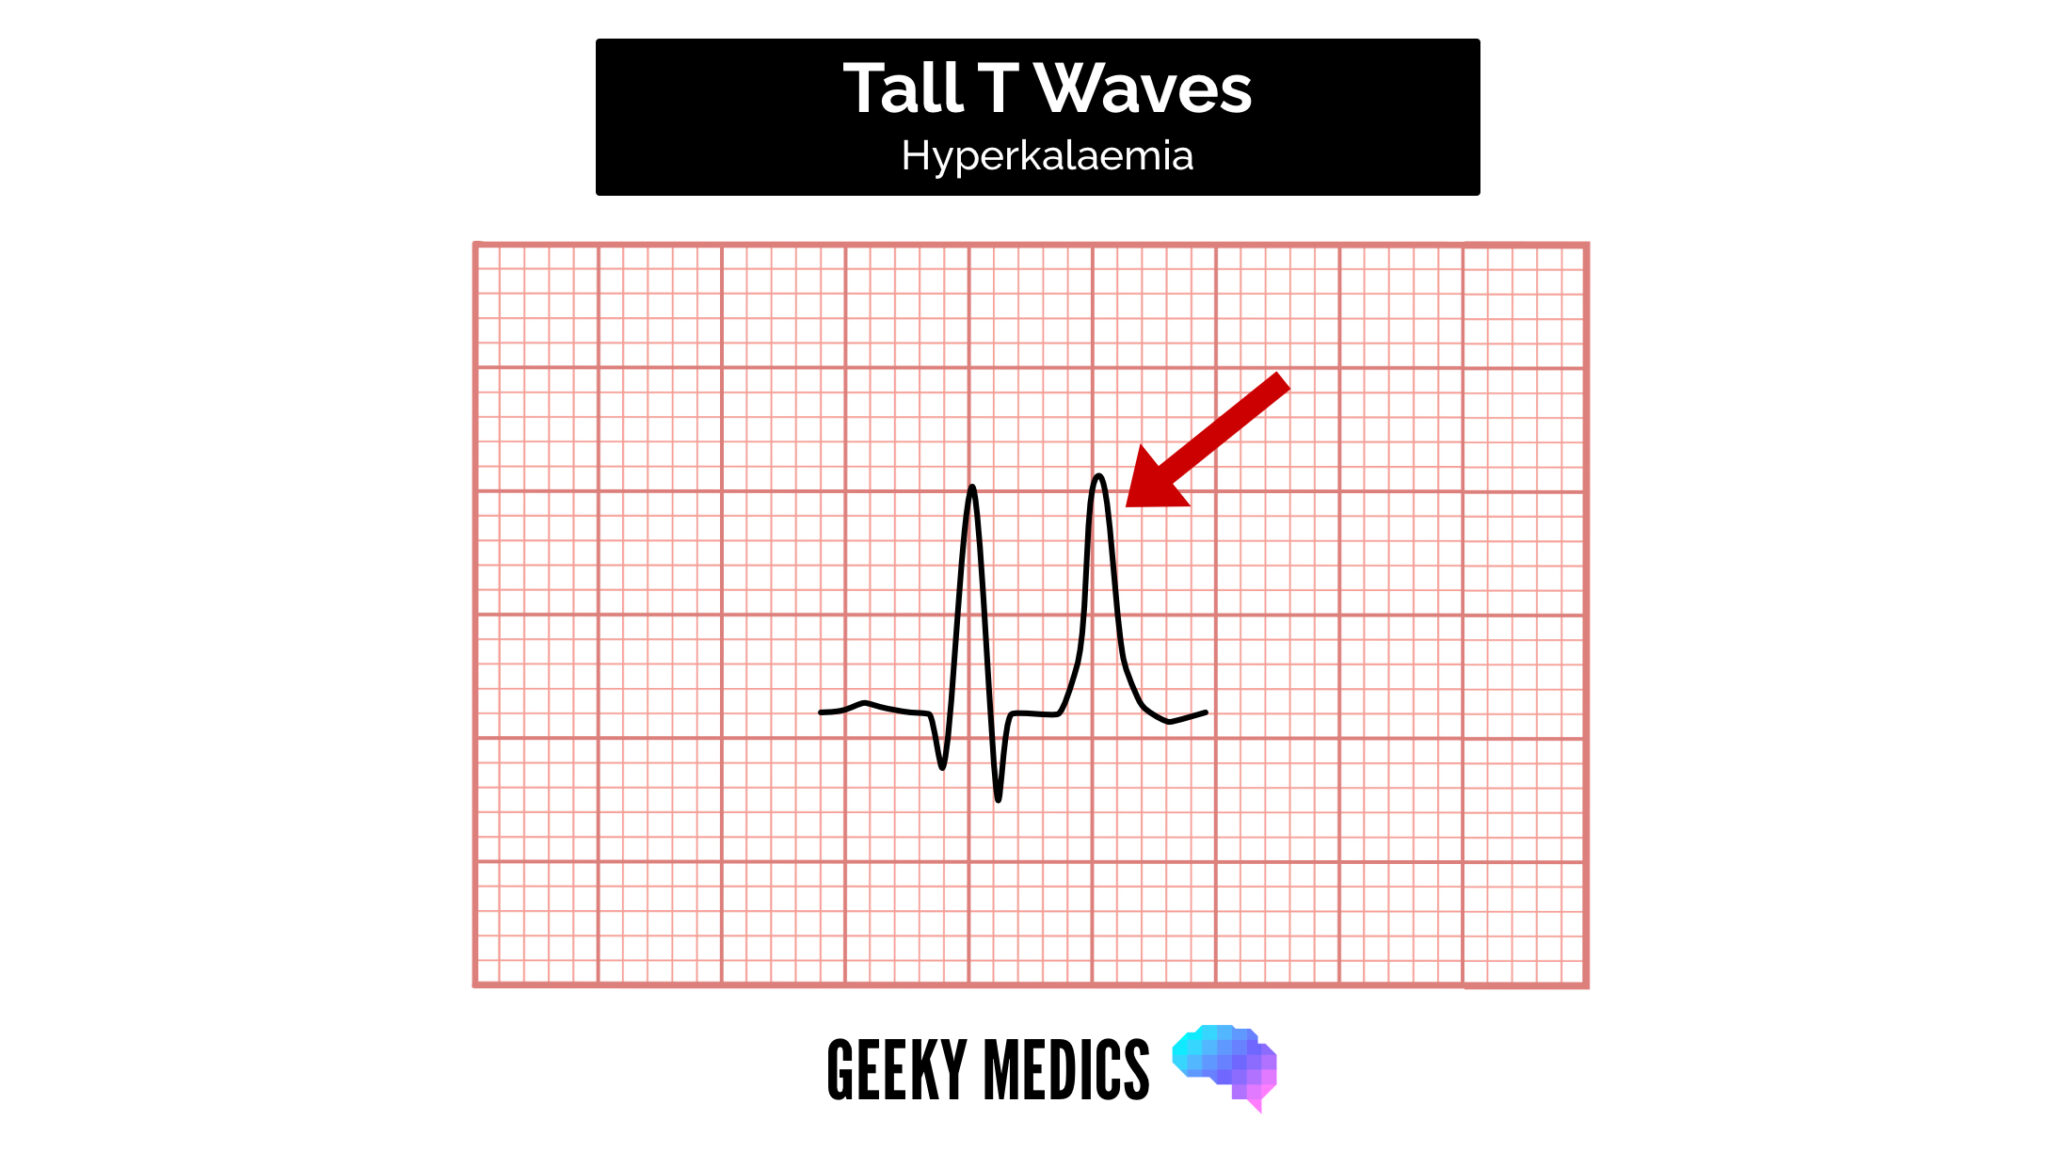
T waves
T waves represent the repolarisation of the ventricles.
Tall T waves
T waves are considered tall if they are:
- > 5mm in the limb leads AND
- > 10mm in the chest leads (the same criteria as ‘small’ QRS complexes)
Tall T waves can be associated with:
- Hyperkalaemia (“tall tented T waves”)
- Hyperacute STEMI
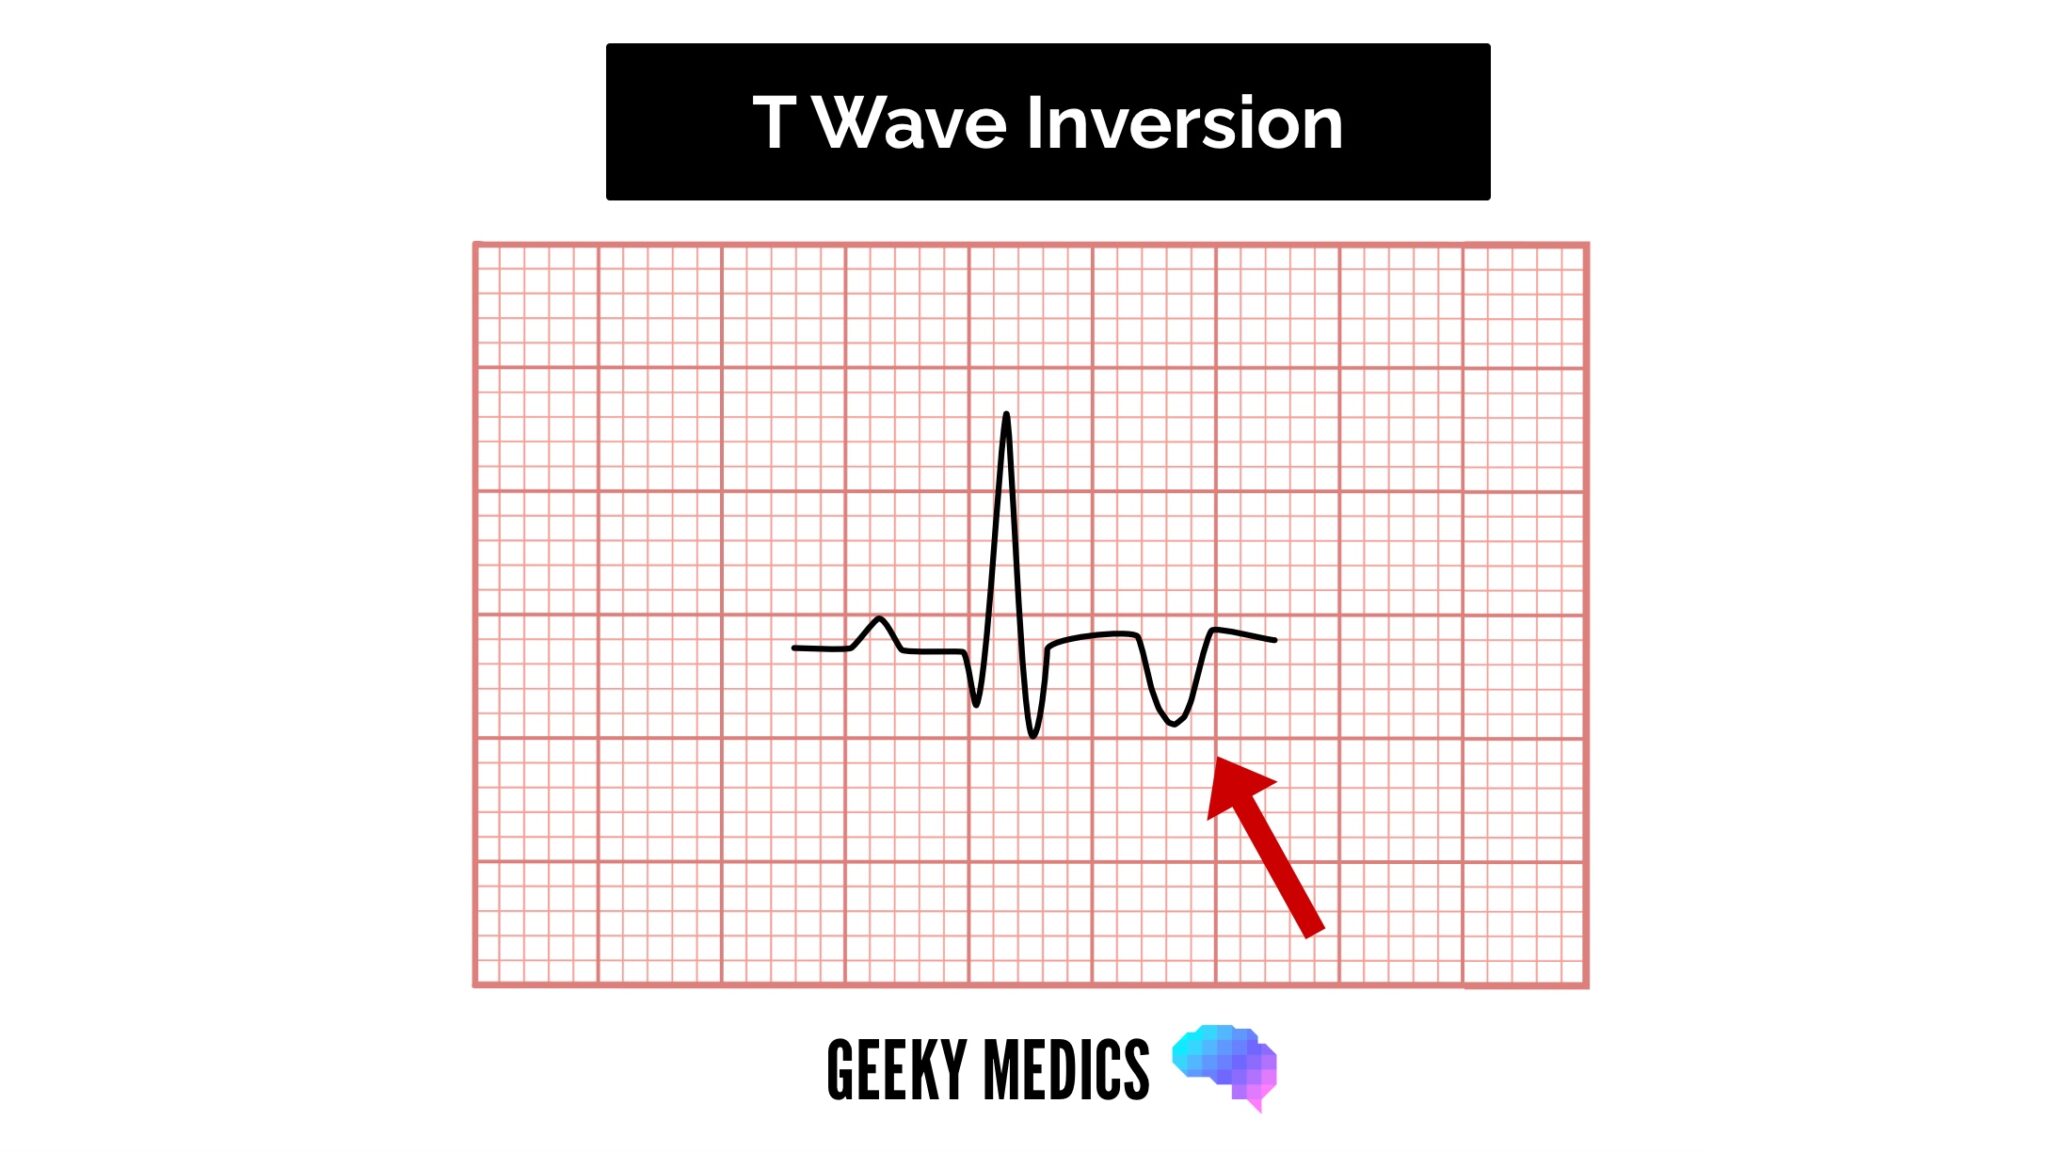
Inverted T waves
T waves are normally inverted in V1, and inversion in lead III is a normal variant.
Inverted T waves in other leads are a nonspecific sign of a wide variety of conditions:
- Ischaemia
- Bundle branch blocks (V4-6 in LBBB and V1-V3 in RBBB)
- Pulmonary embolism
- Left ventricular hypertrophy (in the lateral leads)
- Hypertrophic cardiomyopathy (widespread)
- General illness
Around 50% of patients admitted to ITU have some evidence of T wave inversion during their stay.
Observe the distribution of the T wave inversion (e.g. anterior/lateral/posterior leads). You must take this ECG finding and apply it in the clinical context of your patient.
Biphasic T waves
Biphasic T waves have two peaks and can indicate ischaemia and hypokalaemia.
Flattened T waves
Flattened T waves are a non-specific sign that may represent ischaemia or electrolyte imbalance.
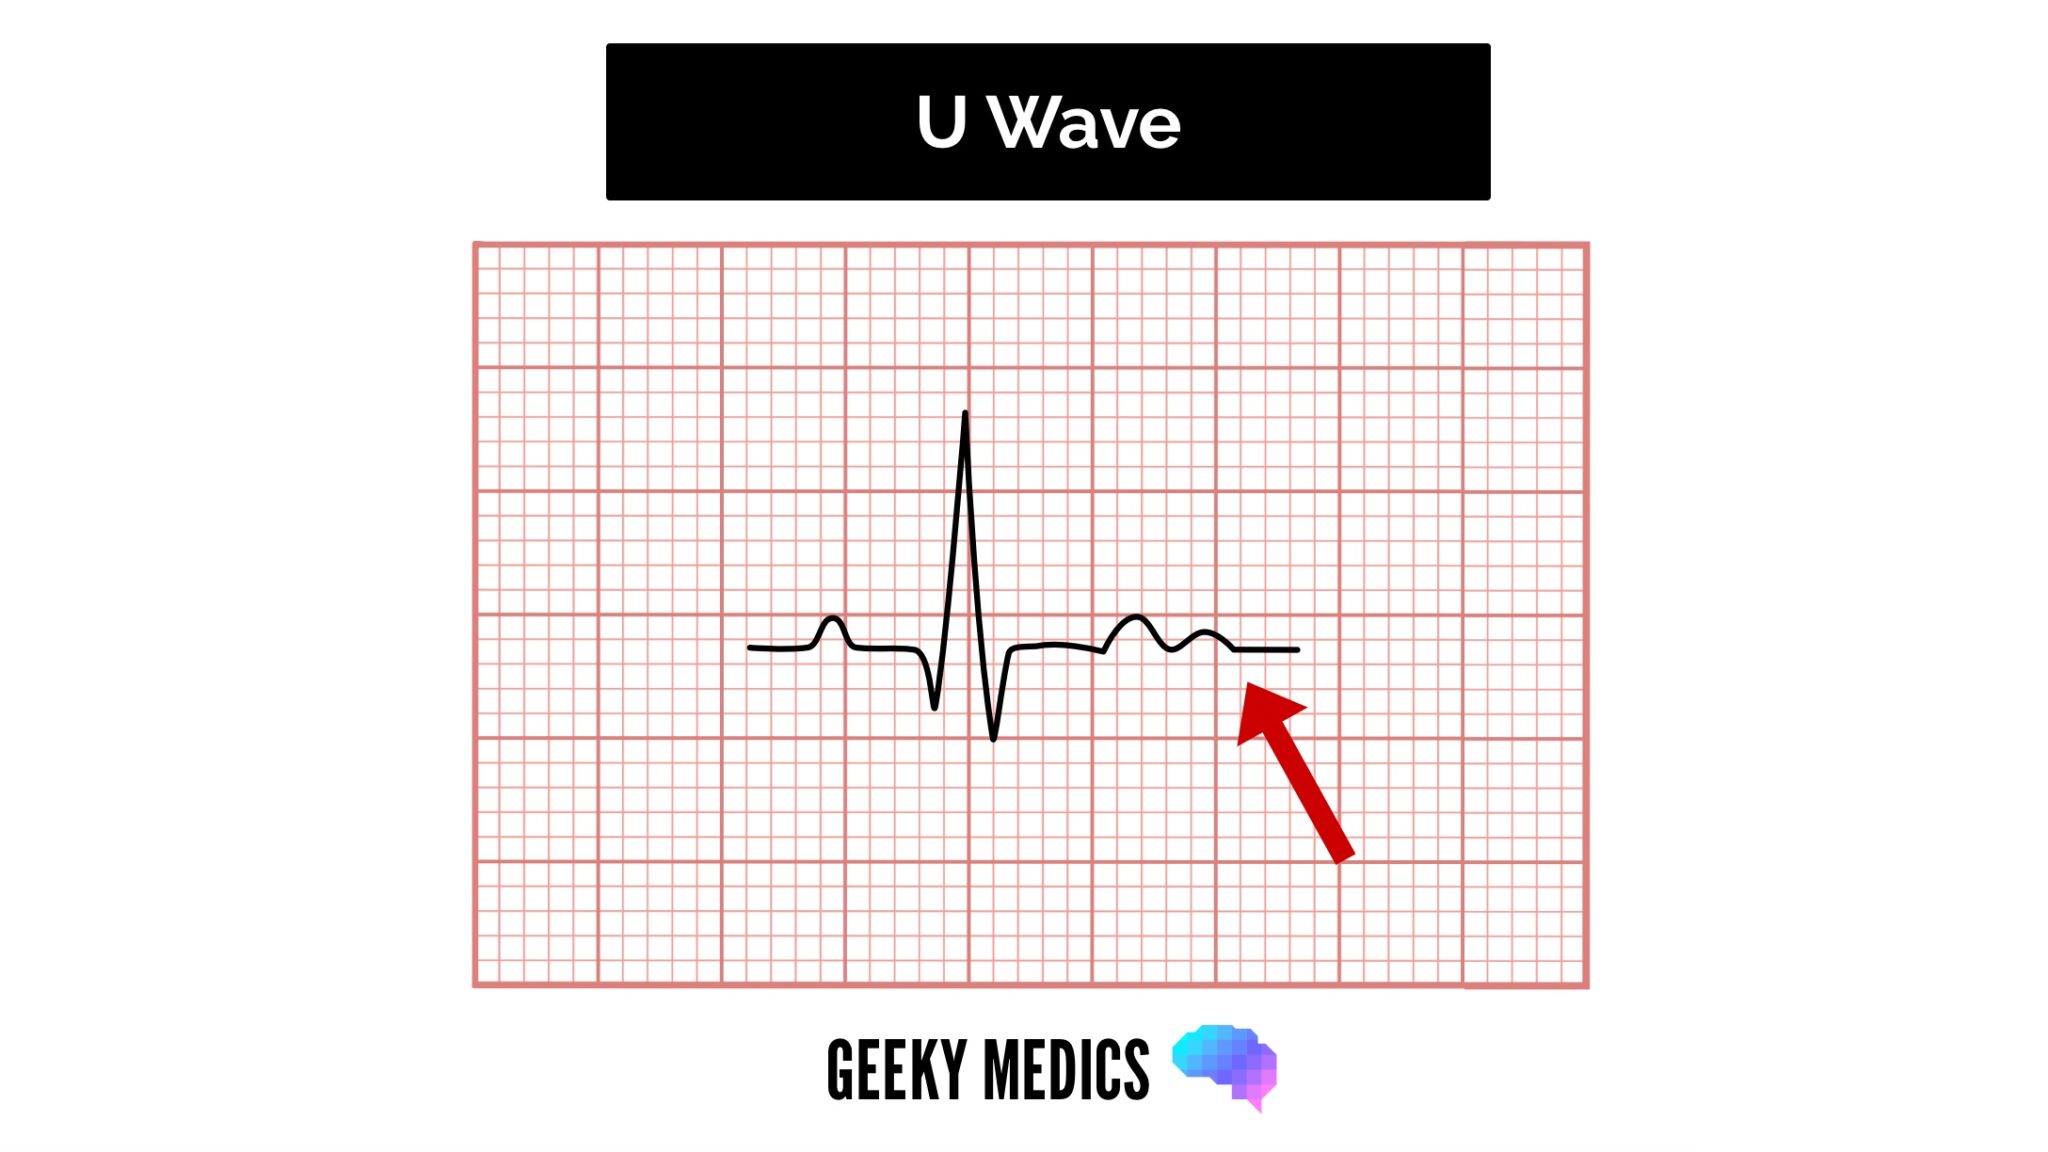
U waves
U waves are not a common finding.
The U wave is a > 0.5mm deflection after the T wave best seen in V2 or V3.
These become larger the slower the bradycardia – classically U waves are seen in various electrolyte imbalances, hypothermia and secondary to antiarrhythmic therapy (such as digoxin, procainamide or amiodarone).
Document your interpretation
You should document your interpretation of the ECG in the patient’s notes (check out our guide to documenting an ECG).
Want to learn more about ECGs?
We have several other articles relevant to ECGs:
- Understanding an ECG: a guide to understanding the underlying concepts of ECGs
- Cardiac axis explained: a simple guide to the cardiac axis
- How to record a 12-lead ECG: an OSCE guide to recording a 12-lead ECG
- How to document an ECG: a guide to documenting your ECG interpretation in the notes
- Bundle branch block: a guide to left and right bundle branch block
Reviewer
Dr Ben Marrow
Cardiology Registrar
References
- Life in the fast lane. ECG library – Poor R Wave Progression (PRWP). License: [CC BY-NC-SA]
